ES Monday 12-15-14
I sure hope Bruce feels better and will post...
someone I know sent me a link to a study of price performance of the S&P 500 cash index in Decembers when there are large jumps in the $VIX.
below is a link to the article and my response to him...
all data believed to be reliable, however no guarantees are implied or expressed.
The pullback in the market this year has triggered this signal... whether the historical pattern repeats has yet to be proven
This is not the Stock Trader's Almanac's mid December lows article, someone sent me a copy of this study,,, it looks like this guy has some neat studies at his blog site.
If you go to the link at the bottom of this e-mail, and then go to his blog you might find things worth knowing for the intermediate term
Maybe you should read the article first, then see my notes below...
http://finance.yahoo.com/tumblr/photoset-this-signal-has-perfect-record-of-forecasting-182907031.html
Here are my comments...
The author of the article is a little wrong in assuming that the VIX goes back to 1986... The original VIX was based on the S&P 100 (the $OEX options volatility) and that data did go back to 1986, BUT, the current VIX is based on Goldman Sacks studies of the S&P 500 Options volatility and it only goes back to 93 or 94... The S&P 100 Vix now uses ticker $VXO), So, for him to say back to 1986 for the VIX, is wrong unless Goldman has produced more back data (doubtful)
I wrote code to look at what he described. His description is wanting... like wanting more precise definitions...
there are 2 ways to interpret the description he offers of VIX High versus 1-month Low of VIX...
1) only compare the High reading of the VIX to the lowest VIX reading of the prior month of trade days (assume 22 trade days a month)
or
2) Only compare the high VIX reading to the lowest L of VIX established in DECEMBER ONLY.
I did not take the time to go to my historical files and pull out my VIX data of the past 28 years because I had enough... I went back to 2004...
He is saying that all 52 times the S&P500 closed higher than the close of the day that registered the extreme VIX reading. OK, well, based on my research of the recent past, that means that he is only looking at VIX Lows registered during the Month of December, not a 22 trade day lookback. (I can say that because I wrote two different sets of code to review which possible filter he was using... Back in 2012 I found the answer... he is comparing VIX H to VIX low established IN the Month of December, not on a 22 trade day look back. I can assume this because in December of 2012, the VIX H based on a 22 trade day look back registered a signal on 12/21/12, but the filter based on comparing VIX H to only the lows that actually occurred during December did not register until 12/27/12 and 12/28/12... The close for the year was above each of these closes, but it did not manage to close above the signal registered 12/21/12 (which was based on a 22 trade day lookback).
Well, if I am correct in this assumption (and this historical trend repeats again), I can tell you that all 4 of this December’s signals occurred when comparing the VIX H to the lowest VIX registered during the month of December...
this signal has been registered for the following trade days
12/9/14 SPX close was 2059.82
12/10/14 SPX close was 2026.24
12/11/14 SPX close was 2035.33
12/12/14 SPX close was 2002.33
and according that article (and assuming a repeat) as of the close on Dec 31, 2014, the S&P 500 should be 2059.82 or higher.
Good morning everyone. Hope everyone had a great last week. Here are today's SD bands.
Click image for original size
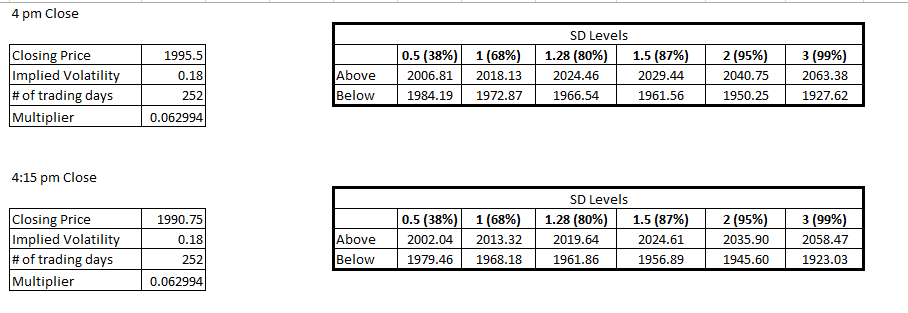
after 3 days of no electric and being sick I'm ready to roll today...the pity party is over......here's how I see it today...overnight is all long so expect some downside and selling to spill over from friday...if it doesn't that is telling us something too......read pauls comments above .....watch spike edge at singles for clues at 2005- 2006 and bell curve center at 2010-2011....ideal shorts will come from one of those two areas...shorts any higher would be more difficult but still doable...Monday is worst day for gap fills...calculate 1/2 gap fill and see if it lines up with any other numbers...like the pivot at 2002 or On midpoint...
didn't mean to say 2014 is the "better spot" ...it's only a good spot because of the LVn and R1 today but based on bell curve theory it isn't very good
starting RTh shorts at 2011..targeting back to On high...still in value from Friday but I am cautious so smaller ...all volume is at 08.75 still
my vpoc went from 08.75 up to 11.25...on a trend up day vpoc flips are good for longs....so I am not convinced my short is going to work...I'm on second try now...being in value I hope will help pull this back down soon...otherwise that 2014 - 2016 is somebodies plan
worked out in the end. good trade Bruce
there's also a great advantage to having no electric...it gives you a chance to read BOOKS in hard copy and old journals.....one thing I read is this
"breakout traders like to buy the plus 4 - 5.5 zone....we as faders will be selling that " so look at today !!!!!
pitbull thread has more on that for those new here
"breakout traders like to buy the plus 4 - 5.5 zone....we as faders will be selling that " so look at today !!!!!
pitbull thread has more on that for those new here
thanks Nk and welcome back...hope u had a good vacation
Thanks Bruce it was a good break from a stressful year so far. I have read through the Pitbull threads several times and there is really good stuff there. Just have to learn to tie in all the concepts and be cognizant of them all at the same time. That is the challenge!
my charts are all messed up. no data coming through and acting all weird. been fighting these issues all day so far....
that's me gone at 88.50...gotta run...kids one pm band concert that I'm gonna be late for catchya all in the morning...good example of how important longer time frame reference points are and how often they get retested......quick rule is that we should never expect only one tpo to print at a weekly and monthly RTH high or low...that's my million dollar idea for today....ha !!!
Emini Day Trading /
Daily Notes /
Forecast /
Economic Events /
Search /
Terms and Conditions /
Disclaimer /
Books /
Online Books /
Site Map /
Contact /
Privacy Policy /
Links /
About /
Day Trading Forum /
Investment Calculators /
Pivot Point Calculator /
Market Profile Generator /
Fibonacci Calculator /
Mailing List /
Advertise Here /
Articles /
Financial Terms /
Brokers /
Software /
Holidays /
Stock Split Calendar /
Mortgage Calculator /
Donate
Copyright © 2004-2023, MyPivots. All rights reserved.
Copyright © 2004-2023, MyPivots. All rights reserved.