ES Thursday 1-8-15
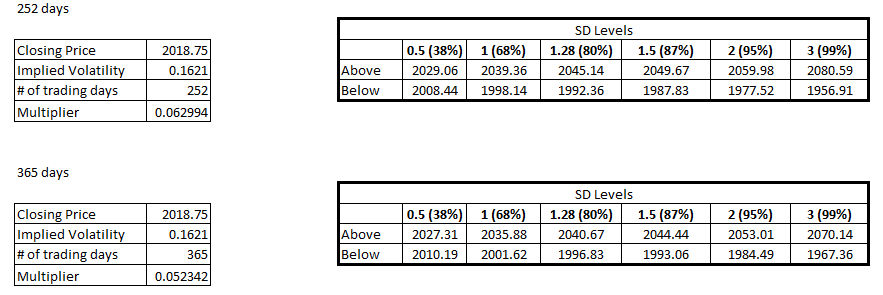
Note the change in bands. Now I am tracking only the 4pm close but both for 365 days as well as for 252 days. Use as you wish. I personally will see what lines up where and then use for confirmation.
Daily chart for tomorrow to follow soon
Daily chart for tomorrow to follow soon
Click image for original size
out at B/E.... sigh
and now it hits what would have been my target.... just about sums up my day... kept the losers and cut the winners..
looking back at my 100 days sample set, there was never an occasion where only R3 was hit. There was one occasion when only R2 was hit and that was a gap up day as well
vpoc of the 1st 30 min hasnt been tested correct? Bruce.the gen x trend indicator do you look at it? the trend indicator is the 22 and 50 ema if anybody wondering.i use it most on the 1 min chart.but the indicator works across all time frames.
what is the idea behind it duck?
thats right duck. the 30-min VPOC has not been tested yet
apk781 its to show the direction the market..
i know that duck...i am asking how it uses those two moving avg to achieve the goal
if the 22 is above the 50 the market is a buy..50 above 22 it sell.
this is just an indicator of direction only.how to enter and exit and stoploss placement is up to the trader to figure out. hope this makes it a little clearer.ya terrible at write my thoughts down..lol
thanks for the video Bruce and the notes. the greenies turned from resistance to support very quickly and i am going to have to adapt to that well enough to not lose money. i pay yet more tuition to the market. i am really hoping it pays off over time....
Emini Day Trading /
Daily Notes /
Forecast /
Economic Events /
Search /
Terms and Conditions /
Disclaimer /
Books /
Online Books /
Site Map /
Contact /
Privacy Policy /
Links /
About /
Day Trading Forum /
Investment Calculators /
Pivot Point Calculator /
Market Profile Generator /
Fibonacci Calculator /
Mailing List /
Advertise Here /
Articles /
Financial Terms /
Brokers /
Software /
Holidays /
Stock Split Calendar /
Mortgage Calculator /
Donate
Copyright © 2004-2023, MyPivots. All rights reserved.
Copyright © 2004-2023, MyPivots. All rights reserved.