weekend charting
This is straight from my personal notes
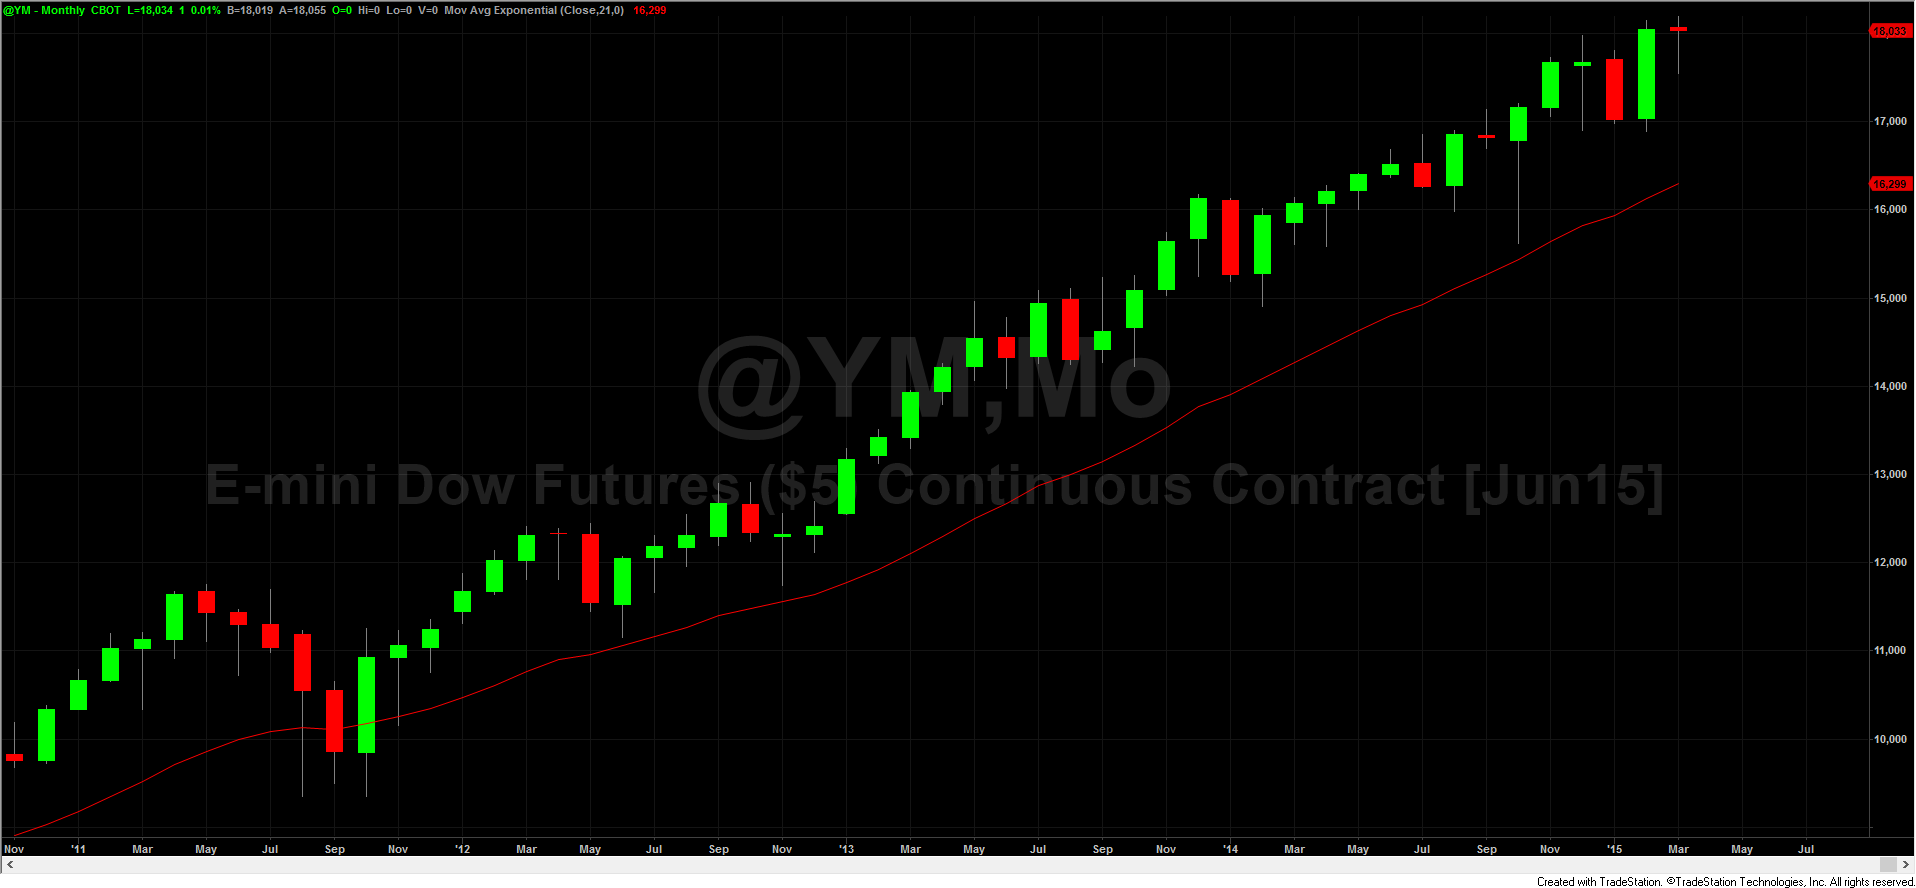
Dow (sorry dow still king and the market I compile us index directional info on)
Monthly inside Feb range near new highs. above 21 ema, slighty HH not a notable HH I think it was only 1 day. caution 7 trading days left in march.
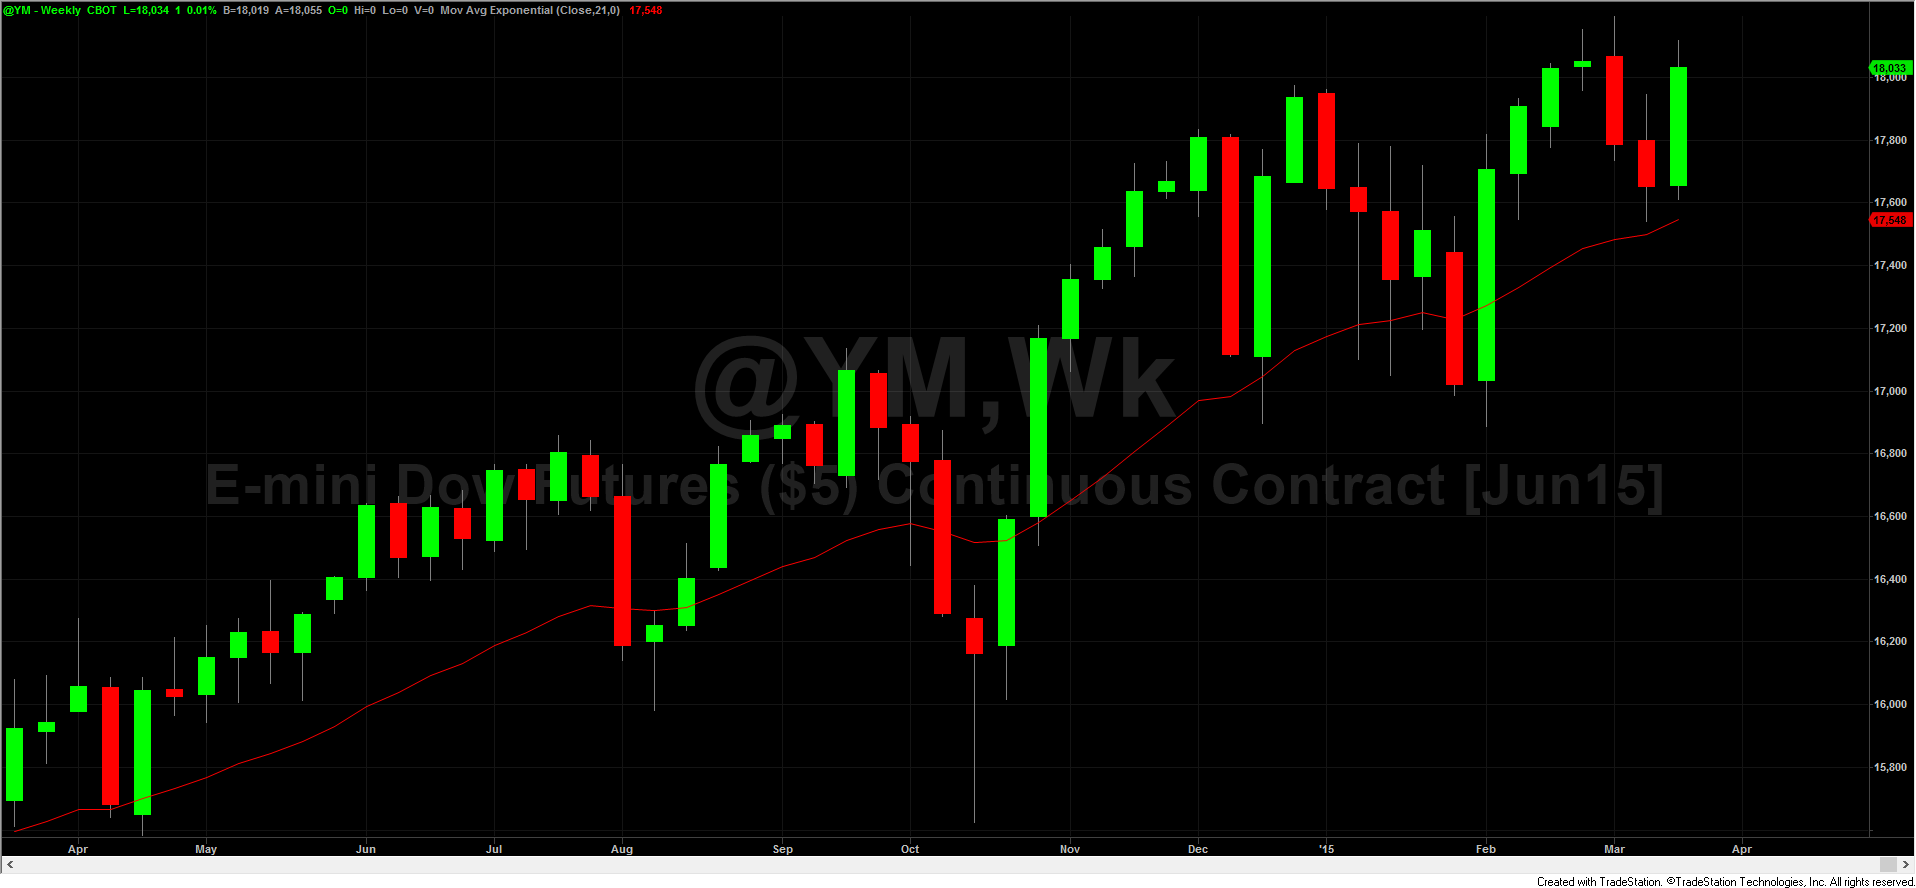
dow mini weekly
HH thrust up bar closed off highs. ym still sideways. Markets continue to bounce of 21 ema from last weeks lows. We have hit ema to may times in last few months.
Dow daily HH closed in y.d. range market is very choppy with strong up tendencies. This does not feel right, something is off. No chart on daily you should be able to draw it from memory if not shame on you. Ym above 21 ema
Crude monthly LL lowest low I can remember and LL of the data I own. Oil rigs have slowed out put and a slower decline than previous weeks but Russia is still dumping unrefined oil b/c of usa and euro sanctions. They need to pay the bills somehow. caution 7 trading days left in march.
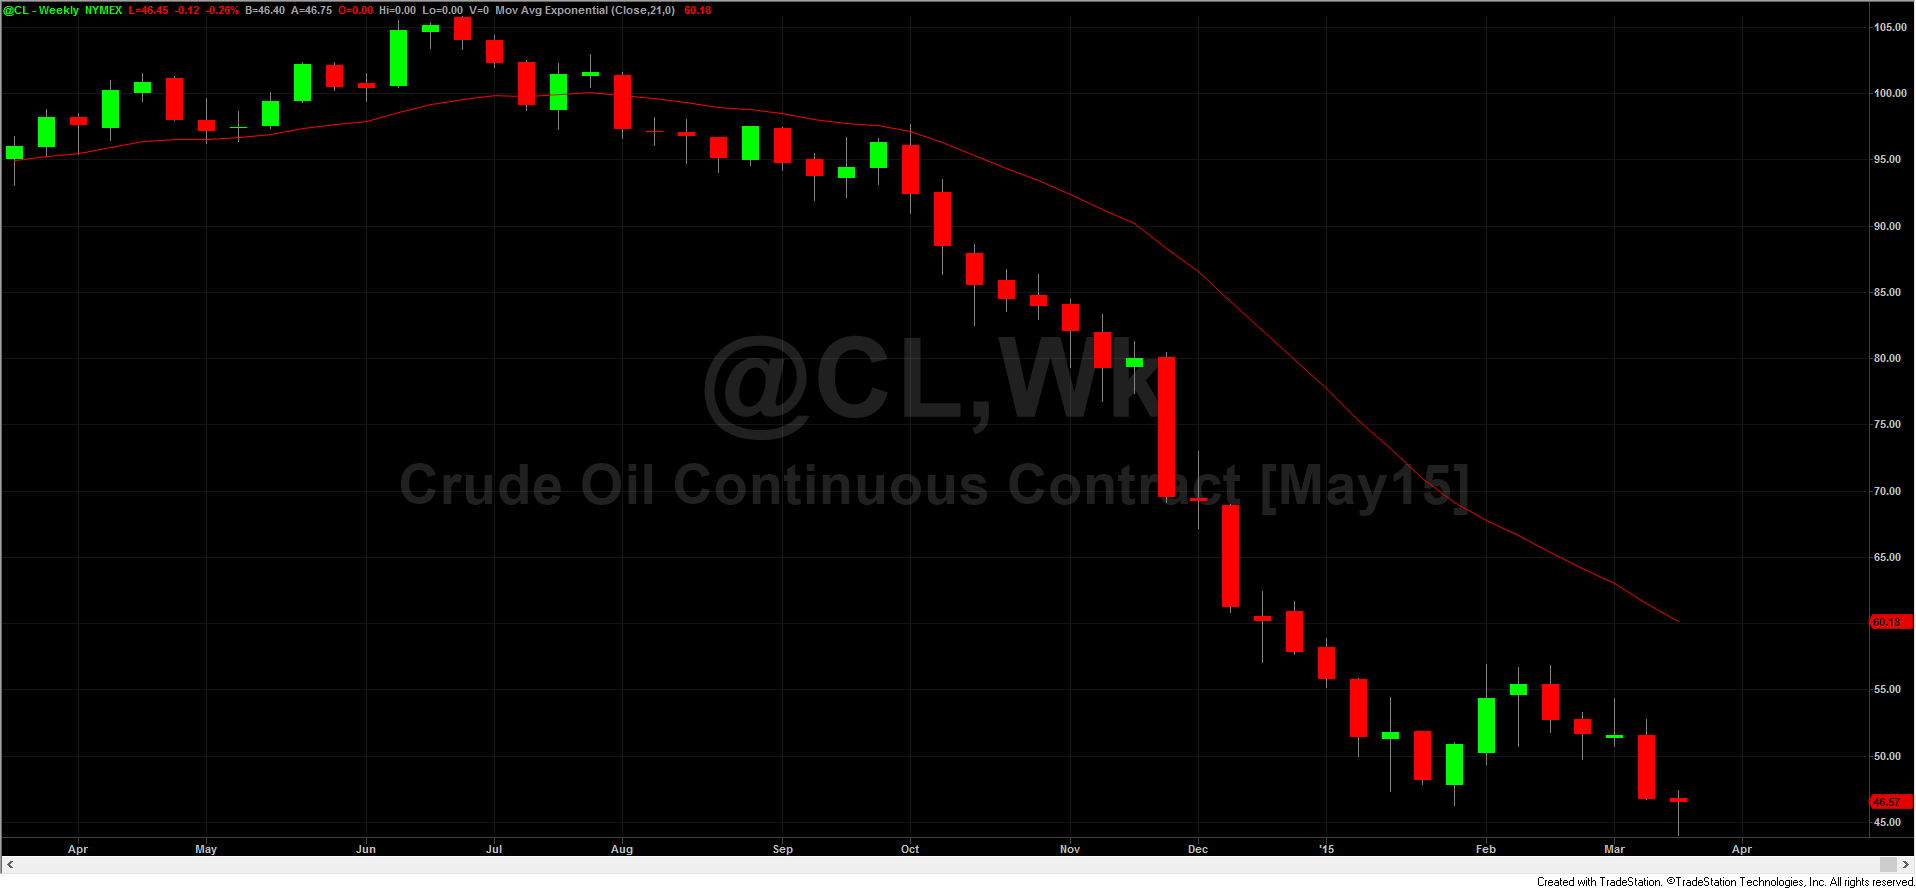
crude weekly massive major stop blowing low on high vol with a reversal and close with in 23% of top range. note this most likely could be front month hedge buying b\c data does not support bounce. most likely daily bounce from here. Caution watch wkly hi and lo for indication of us index futures
10 yr notes
Monthly saw an inside bar (7days left in mar, very important) channel still strongly intact. after massive thrust in dec.
weekly strong HH, close above 21ema, this weeks highs were jan2015 lows. Ill be watching this to see if this is range (which most likely is) or are we breaking to HH? Ithink a test of 130'27.5 is not out of the question.
daily the 5yr is producing a few great trades for longs as most are moving to short term as an expected rate hike. Which I do not see happening anytime this year. because once you drop your rates to 0 you see a stagnate growth less economy like japan 30 yrs ago. There is no inflation, no growth, little wage increase and your a doff to think this is an area to raise rates. And now oil is sub 50. yeah bonds are gonna stay high for a while.
metals
silver and gold matched lows on monthly and reversed strongly. but still below the 21ema monthly. and still inside last months range. with obvious downtrend still intact
weekly silver posted a large up move. closing at the 21 ema
Ill be looking at silver closely over the next few months as I am expecting a move to 20 and then 25+ by jan 2017 we will make some nice profits in silver options and physical gold.
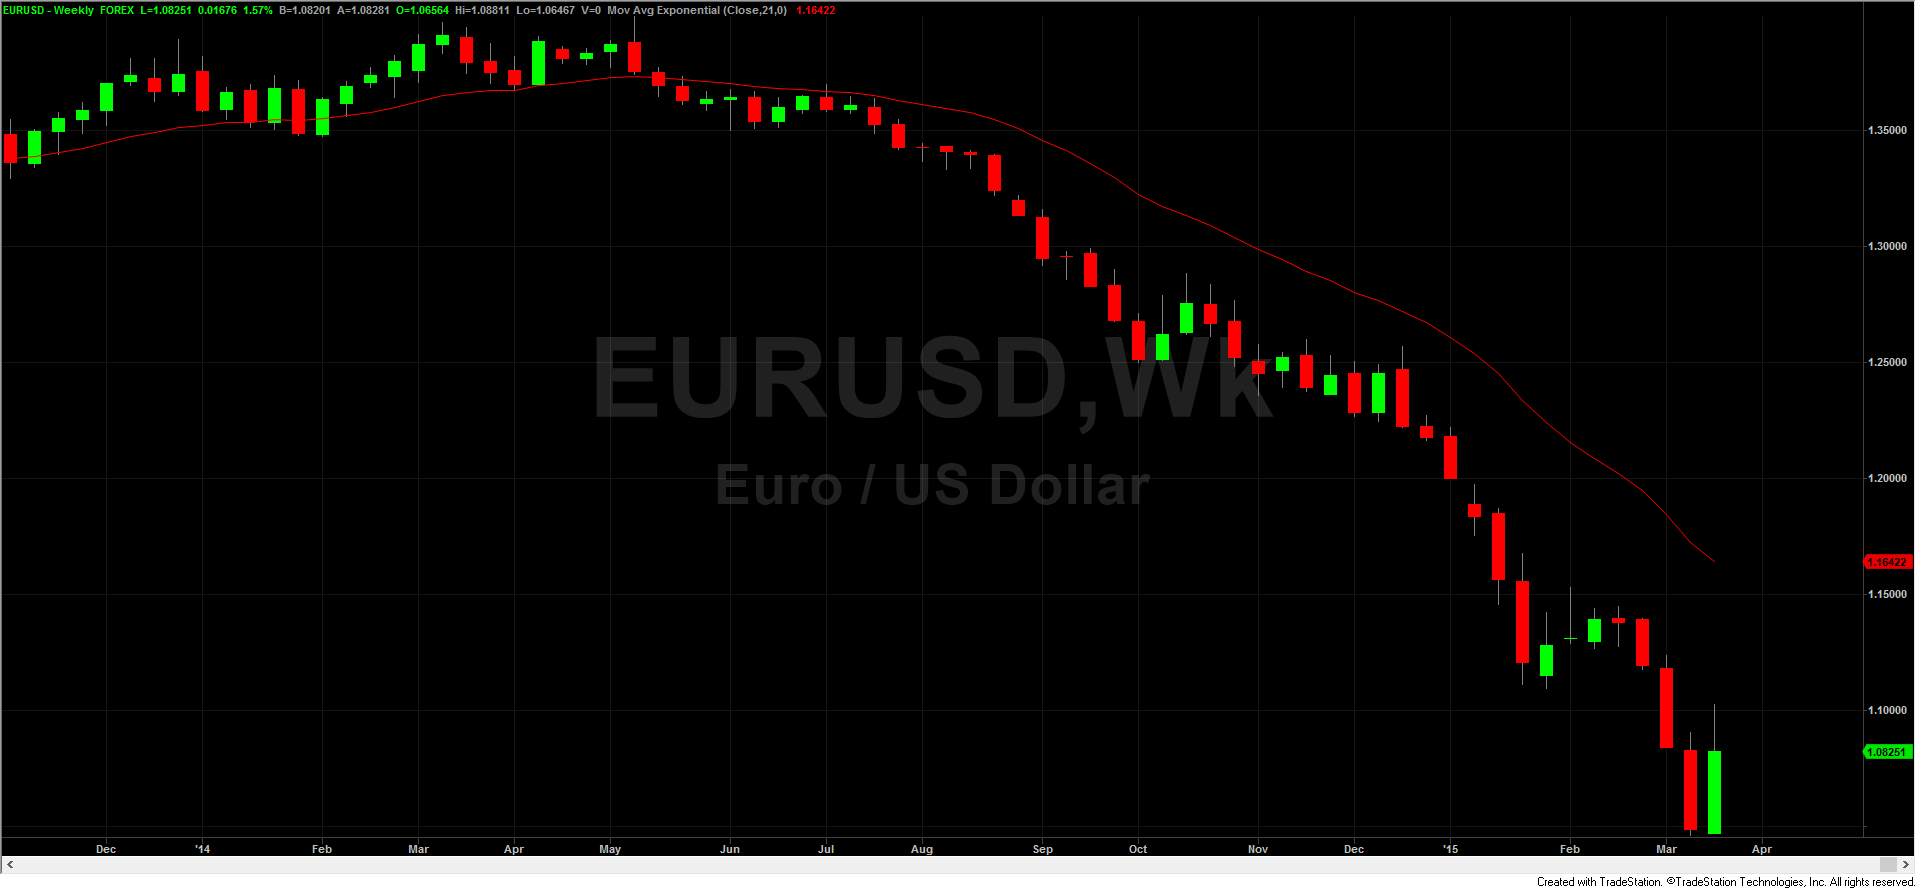
And I think the mover of the year goes to the EurUsd
monthly is putting in what seems a long term bottom. lows of 1.0461 were massively rejected ( a hat tip to yellen) and a run up to 1.10 something with a pull back to 1.08. looking for much higher prices. Greece isn't a problem they are the size of MT. I can remember when dollar was king in 04 then in 09 they were talking about the euro was king and how the usd wasn't going to be the reserve currency any more, and today its the best thing out there.
weekly....you have to go back to oct 12 to see a up thrust this large in eurousd going to be a great next few weeks in the euro
Dow (sorry dow still king and the market I compile us index directional info on)
Monthly inside Feb range near new highs. above 21 ema, slighty HH not a notable HH I think it was only 1 day. caution 7 trading days left in march.
Click image for original size
dow mini weekly
HH thrust up bar closed off highs. ym still sideways. Markets continue to bounce of 21 ema from last weeks lows. We have hit ema to may times in last few months.
Click image for original size
Dow daily HH closed in y.d. range market is very choppy with strong up tendencies. This does not feel right, something is off. No chart on daily you should be able to draw it from memory if not shame on you. Ym above 21 ema
Crude monthly LL lowest low I can remember and LL of the data I own. Oil rigs have slowed out put and a slower decline than previous weeks but Russia is still dumping unrefined oil b/c of usa and euro sanctions. They need to pay the bills somehow. caution 7 trading days left in march.
crude weekly massive major stop blowing low on high vol with a reversal and close with in 23% of top range. note this most likely could be front month hedge buying b\c data does not support bounce. most likely daily bounce from here. Caution watch wkly hi and lo for indication of us index futures
Click image for original size
10 yr notes
Monthly saw an inside bar (7days left in mar, very important) channel still strongly intact. after massive thrust in dec.
weekly strong HH, close above 21ema, this weeks highs were jan2015 lows. Ill be watching this to see if this is range (which most likely is) or are we breaking to HH? Ithink a test of 130'27.5 is not out of the question.
Click image for original size

daily the 5yr is producing a few great trades for longs as most are moving to short term as an expected rate hike. Which I do not see happening anytime this year. because once you drop your rates to 0 you see a stagnate growth less economy like japan 30 yrs ago. There is no inflation, no growth, little wage increase and your a doff to think this is an area to raise rates. And now oil is sub 50. yeah bonds are gonna stay high for a while.
metals
silver and gold matched lows on monthly and reversed strongly. but still below the 21ema monthly. and still inside last months range. with obvious downtrend still intact
weekly silver posted a large up move. closing at the 21 ema
Click image for original size

Ill be looking at silver closely over the next few months as I am expecting a move to 20 and then 25+ by jan 2017 we will make some nice profits in silver options and physical gold.
And I think the mover of the year goes to the EurUsd
monthly is putting in what seems a long term bottom. lows of 1.0461 were massively rejected ( a hat tip to yellen) and a run up to 1.10 something with a pull back to 1.08. looking for much higher prices. Greece isn't a problem they are the size of MT. I can remember when dollar was king in 04 then in 09 they were talking about the euro was king and how the usd wasn't going to be the reserve currency any more, and today its the best thing out there.
weekly....you have to go back to oct 12 to see a up thrust this large in eurousd going to be a great next few weeks in the euro
Click image for original size
Click image for original size
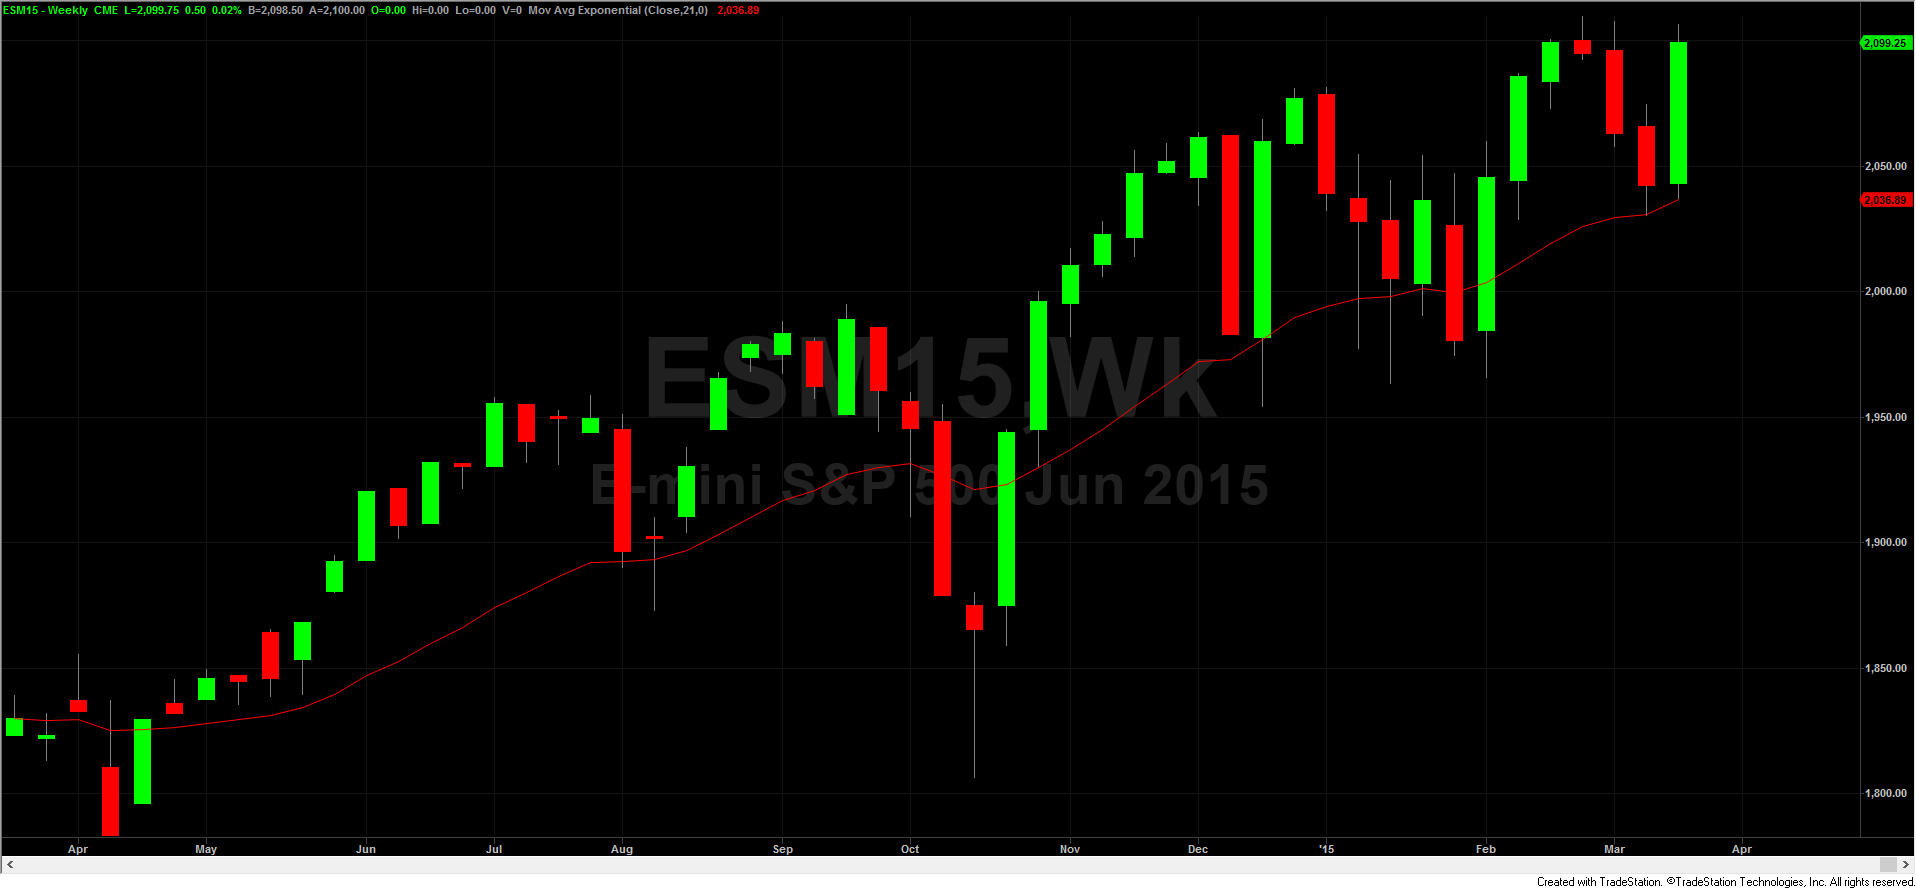
here is a weekly on ESM15 a very nice HH and notice the bounce off the EMA, almost back to all time highs.
@CharterJoe - thanks for the images and the commentary.
I noticed that you saved the images as .bmp files. This means that each image is around 5Mb in size which is fairly big and probably took you a long time to upload them. I also notice that you're using TradeStation.
On TradeStation v9 help page it says:
I noticed that you saved the images as .bmp files. This means that each image is around 5Mb in size which is fairly big and probably took you a long time to upload them. I also notice that you're using TradeStation.
On TradeStation v9 help page it says:
Save As PictureNow I'm guessing that somewhere on that Save As Picture dialog there's an option to change the file type from bmp to jpg. The charts/images will have the same quality but will be much smaller in size and take you less time to upload. It will take traders on slower connections less time to show the page as well.
Use this option to save a window or workspace from the TradeStation Desktop as a Windows Bitmap (*.bmp) or JPEG image (*.jpg).
Access using the menu bar File > Save As Picture menu sequence. The Save As Picture dialog is displayed.
ok, will do thanks.
Straight from my notes. But no charts. I am saving them but cant find them for some reason.
Starting with the euro. the monthly is still an inside month, with higher prices rejected in the April candle leaving a large wick for at least the time being. If we close red for april this will be the 10th month down in a row for EU. Weekly chart took a large hit. Taking out the last two weeks lows with little effort. Looking over my statements I made around 200 r.t. in this pair this week and only 3 were longs. This type of strong conviction ought to be alarming. Weekly is approaching lows of 1.0473 and oversold. Daily saw the lows of 1.0725 on 3/31 taken out mid week, This was many eu bulls line in the sand. Large stops slapped them down over 100pips lower very quickly. GB central banks have told the banks to keep enough cash on hand to handle a grexit. Countries default all the time (remember mexico? or argintina?) If this does happen I would expect them to pop to 1.2000 within a blink of an eye.
The dow put in a very nice week. We are getting in the upper end of the daily trading channel. HH are reinforced with buyers and LL on the daily are meet with buyers so until something changes look to buy. My stochastic is not overbought on the daily. Weekly is in HH mode, going sideway ways at the top we havnt made new highs in over 5 weeks so that may be something that will happen this coming week. Monthly is still an inside bar on the YM.
10yr notes on the monthly has put in a HH and has since sold back to Aprils lows. leaving a large selling spike. Stochastics have been over sold for a while. maybe due for a sell off to the 125`16 level in the next few weeks. Weekly saw an inside week with a close 100% bearish on its lows. looking for shorts below 128`24. Daily is oversold but resting on the low of 128`24 unable to break y.d. lows
Crude for April is inside bar sitting near its 50% range. Weekly saw HH but pulled back mostly on supply issues mid week. when we saw that large gap and then a 3% sell off from there They were expecting 3.3million barrels and we had over 10million. From what Im finding out is the glut is b/c Russia is dumping unrefined oil in the market to offset the low prices. I don't see oil staying above 50 for long until demand can pick up. Oil daily closed every day this week above 50. LL were meet with buyers Friday. But was unable to take out 4/9s highs. Stochastics remain overbought and falling below 80 Friday morning.
Forgot silver, as it is becoming less and less volatile on the monthly. We have been in a super tight trading range since oct. The weekly has seen yet another OB. as bulls and bears cant get together on a direction. Daily took out 3/31s lows but then trading back into them on Friday and then selling off leaving a tail on Fridays trading. Lots of great trades on exhaustion in the opposite direction and I see no way of changing my style for next week. Actually look for more of the same until inflation goes higher.
Anyway if anyone is reading this and say I only scalp this info isn't important. It is and this is my style I soak up as much info and charts as I can (not the crap on cnbc but mostly news releases fed minutes Bloomberg, yield curves, eruo QE, bund rates etc.) I am a very high frequency trader, probably everyone on mypivots would say I trade to much to often. To each his on, but I look at the current months trading, where we are in the week, daily. Also what did the other parts of the world do last night? look at ECM15 most trend changes are at 3a.m. and 8.am. then minor changes at 2pm and 7pm. The reason I bring this up is this is common knowledge that markets reverse at different times of the day. And it works the exact same on higher t.f. Just as the euro is likely to be topping out at 8am when the American traders start arriving at work, the same is true at different times in the week and month. So if trade for 2min or 2hrs pull up some longer time frames and work your way down to your favorite time frame.
The YM monthly is still inside march range. With stochastics falling (been oversold since 2012 LOL so take it with a grain of salt) and im starting to see a clear bowl formation, which is my go to pattern. Remember the old saying sell in may and go away.....16500 in the next couple of months is not out of the question. On the weekly im seeing a tight range for the week and when we bust that next week we are going to have some great trades. weekly high for the Dow 18093 ES 2105.5 and Dow low 17666 ES 2064.5 keep these levels in mind as Im sure there will be stops below. Weekly isn't looking so negative, holding near all time highs I would expect an all time high then a correction lasting at least till fall. So with that in mind if we do continue to slide lower this doesn't look like a blow out top to me. But then again they never ask me if this looks like a good place to end a run. Daily Dow obviously looks bearish. The stochastics have fallen below 80. obvious target the lower end of the range 17500.
10yr notes heading back up to the highs for April. This slow non stopping advance upwards seems to be picking up volume and steam. on the weekly near January highs of 130`17.5 but bulls looking tired. and the daily is up 5 days in a row so Im sure 10yr bears at this point are either already on board defending their position (shorting new highs) or will be stepping in very soon. so some great trades in the 10yr next week on first sighn of weakness.
And the market I adore The Euro, Its in my blood. Once upon a time I could short 10 contracts and go to bed and sleep all night. But the uncertainty that's been cursing this market like its very own plague over 500yrs ago, that started with LEH collapsing in 2007 and better known as "Greece Crisis" that started in 2010 is coming to an end They`re either going to come up with the money in May and have enough to pay its workers and show the world the euro works and can heal its own wounds or its going to tell its creditors to blank off, and keep the 1billion to pay its workers. I cannot tell you how much I wish this was over, but its not so we must all deal with it and not go numb every time we hear grexit. It is important. That said April is still an inside bar. with a low of 1.0529 and a high of 1.1047 so obvious places for long term stops. Weekly made a 4 weeklow but reversed and closed near its highs. And Fridays trading closed some 50pips off its high after being up 4days in a row. Once again Im seeing some good trades in this pair to the down side when we break Fridays lows.
Crude Oil new April highs this week. Weekly closed in the top 75% of its range this week and up 4 weeks in a row. And the daily overbought putting in an inside day Friday so a clean break of the lows Friday should be allowed to run a little farther as last weeks pop was on cut inventories, as opec has been showing no sign of slowing production, Icant wait to see next weeks numbers in a long term oversold and short term way over bought market great trades either way.
And metals not really worth mentioning as last weeks range was even tighter. But as soon as inflation creeps in look for great buys in silver at these low 16 levels.
And an honorable mention to The British pound seems to be roaring off its lows with increased ATR. With its largest weekly move up since 2009 range lows. So look to buy them next week on any sell offs as its like picking money up off the street as everyone will be scrambling to cover shorts placed over the last 10months.
Emini Day Trading /
Daily Notes /
Forecast /
Economic Events /
Search /
Terms and Conditions /
Disclaimer /
Books /
Online Books /
Site Map /
Contact /
Privacy Policy /
Links /
About /
Day Trading Forum /
Investment Calculators /
Pivot Point Calculator /
Market Profile Generator /
Fibonacci Calculator /
Mailing List /
Advertise Here /
Articles /
Financial Terms /
Brokers /
Software /
Holidays /
Stock Split Calendar /
Mortgage Calculator /
Donate
Copyright © 2004-2023, MyPivots. All rights reserved.
Copyright © 2004-2023, MyPivots. All rights reserved.