ES Friday 5-13-16
Friday the 13th ..beware..52 - 53.50 is magnet price for me in early pre market trade.....making video ramble for those interested and will edit this post to include that and some screen shots for those who don't want to listen to me babble
here is video..will edit with some typed in zones
here is video..will edit with some typed in zones
i wonder if there are any stats out there on how often do Fridays end up being trend days. I suspect they are range days for the most part because it is the end of the week...
now all we need to make it a great day is test to On midpoint....that seems like a long way down but we took the 59's so we are good for today...the rest will be a bonus...but damn this isn't easy today...taking low time at 57 now...last is on for midpoint if real lucky
we need our low time price and open print to give way...no good place for stop on last contract
30min VPOC just shifted down to 58 from 62 and the last little pop was off the open.....
seems with weekly options that expire each friday they trend early and then fizzle but I have nothing to really back that up.....I have no patience in here and hate that we are inside YD value...just seems like it will be harder to trend it back to that midpoint....I have buy limit at 54.25...don't want a friday torture session
Originally posted by NewKid
i wonder if there are any stats out there on how often do Fridays end up being trend days. I suspect they are range days for the most part because it is the end of the week...
yeah, this is just a lot of jerking around.....
I think there were a couple of reports out at 10 eastern so maybe that contributed a bit too...
I think there were a couple of reports out at 10 eastern so maybe that contributed a bit too...
amazing how these seem to be such "Traders" markets...all us small frys battling it out against each other..high time as per one minute YD was at 62.75 ...today it is at 58 so hoping price is being accepted at LOWER prices...but it is early
Click image for original size
stop loss now is at 60.50 so this drive down now has to come now or I will exit last runner
flat... that was tortuous but paid off!!
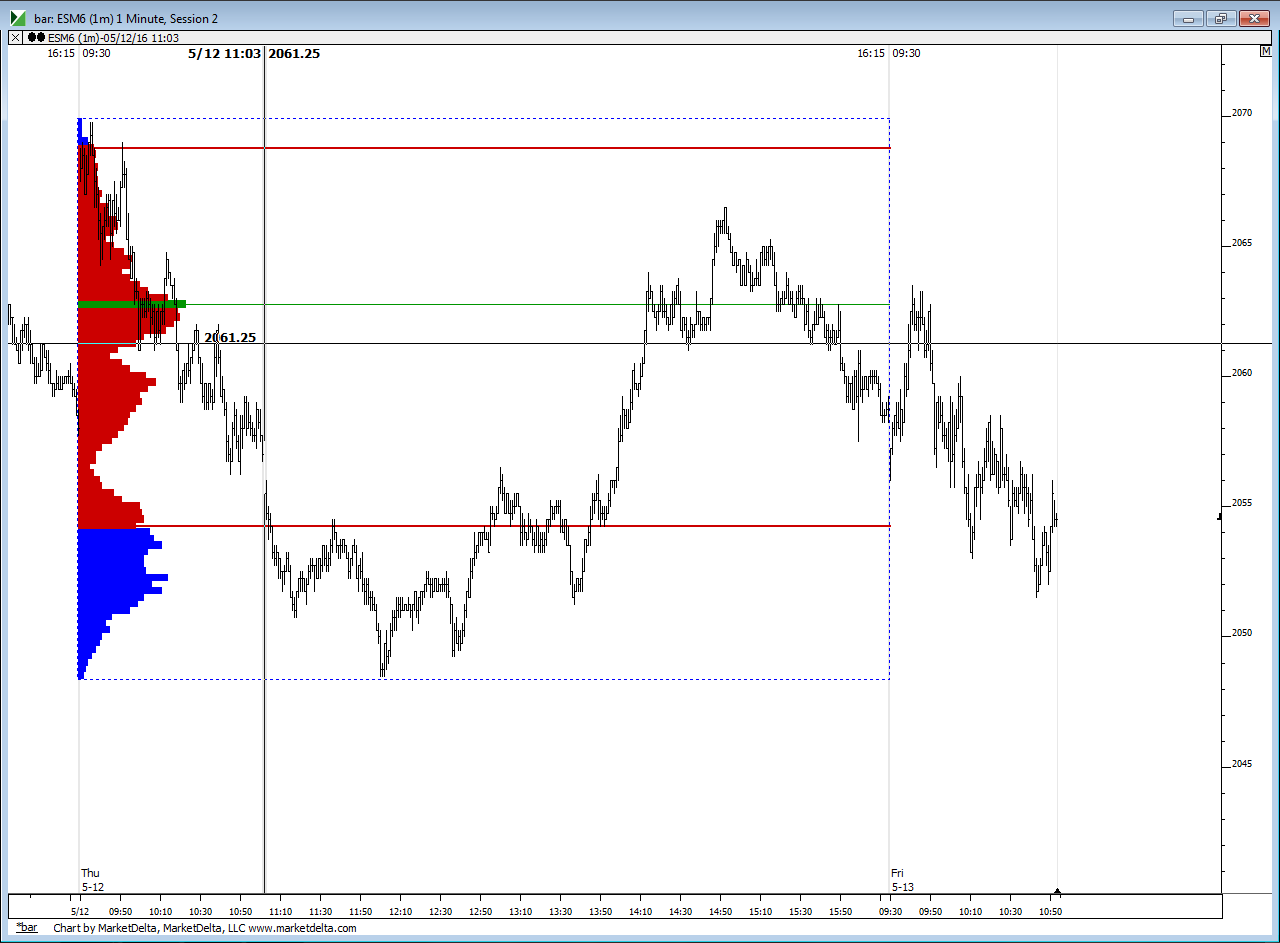
just can't get rid of me today...I'll leave you with this...its a one minute time profile...red area is value area based on one minute but this also shows the high and low time prices...this chart is showing thursdays time profile on the left and you can see how todays lines have reacted to some of the areas it generates....it helps me see price action areas a bit better some days
If I was a vendor I'd be telling you to look and see how great it was that the high time of yesterday, the green line, nailed the current high for today...and I would tell ya how great it was that the VA low had some nice pops up off it...the 54 area...but you can see how this helps define magnet zones etc..ok nuff said..
couldn't get the damn cross hairs off the chart...so ignore that 61.25 label and the cross hairs
If I was a vendor I'd be telling you to look and see how great it was that the high time of yesterday, the green line, nailed the current high for today...and I would tell ya how great it was that the VA low had some nice pops up off it...the 54 area...but you can see how this helps define magnet zones etc..ok nuff said..
Click image for original size
couldn't get the damn cross hairs off the chart...so ignore that 61.25 label and the cross hairs
Emini Day Trading /
Daily Notes /
Forecast /
Economic Events /
Search /
Terms and Conditions /
Disclaimer /
Books /
Online Books /
Site Map /
Contact /
Privacy Policy /
Links /
About /
Day Trading Forum /
Investment Calculators /
Pivot Point Calculator /
Market Profile Generator /
Fibonacci Calculator /
Mailing List /
Advertise Here /
Articles /
Financial Terms /
Brokers /
Software /
Holidays /
Stock Split Calendar /
Mortgage Calculator /
Donate
Copyright © 2004-2023, MyPivots. All rights reserved.
Copyright © 2004-2023, MyPivots. All rights reserved.