ES Tuesday 5-17-16
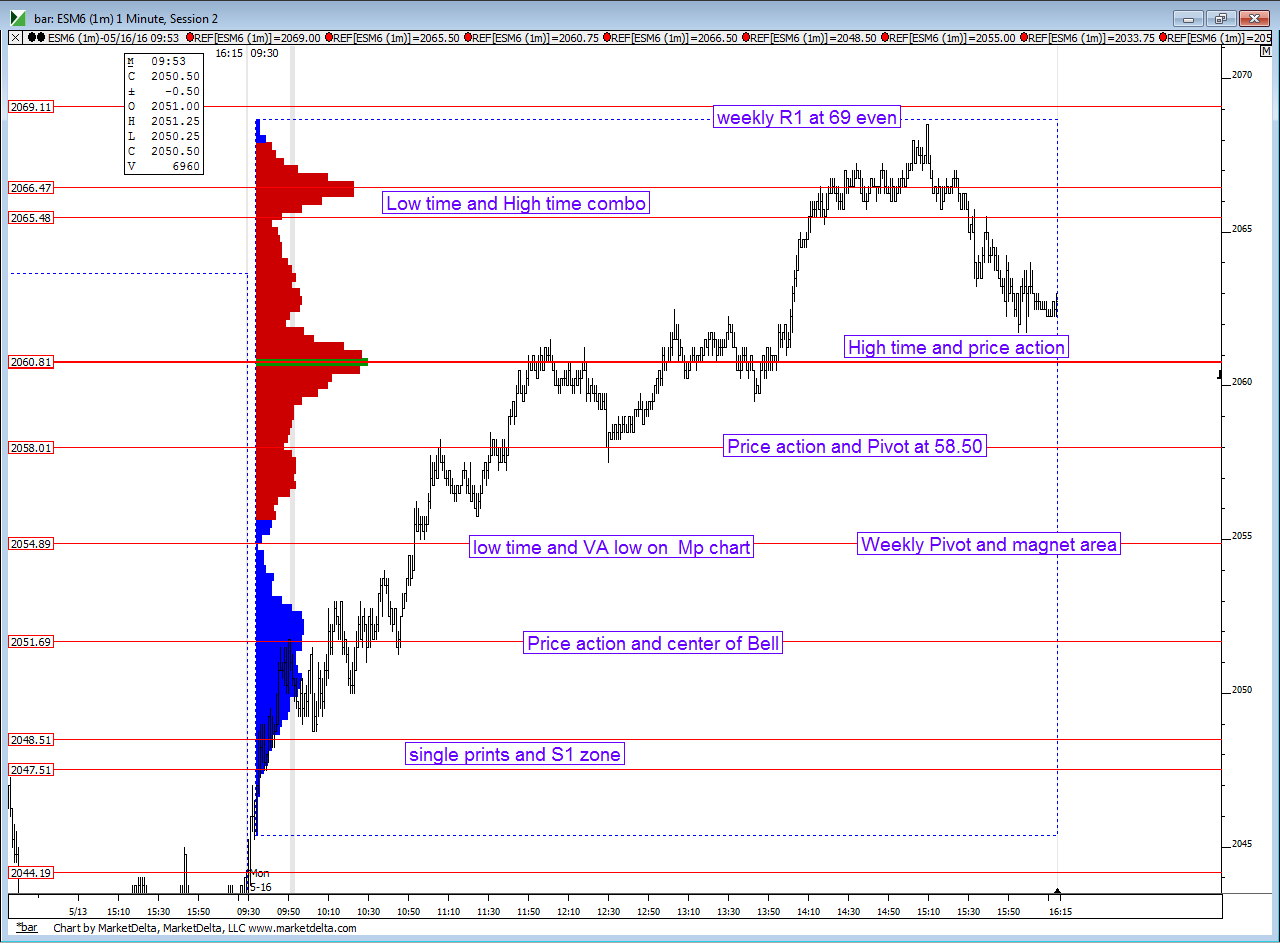
This first chart is how I have lines snapped to note the key areas from Mondays trade
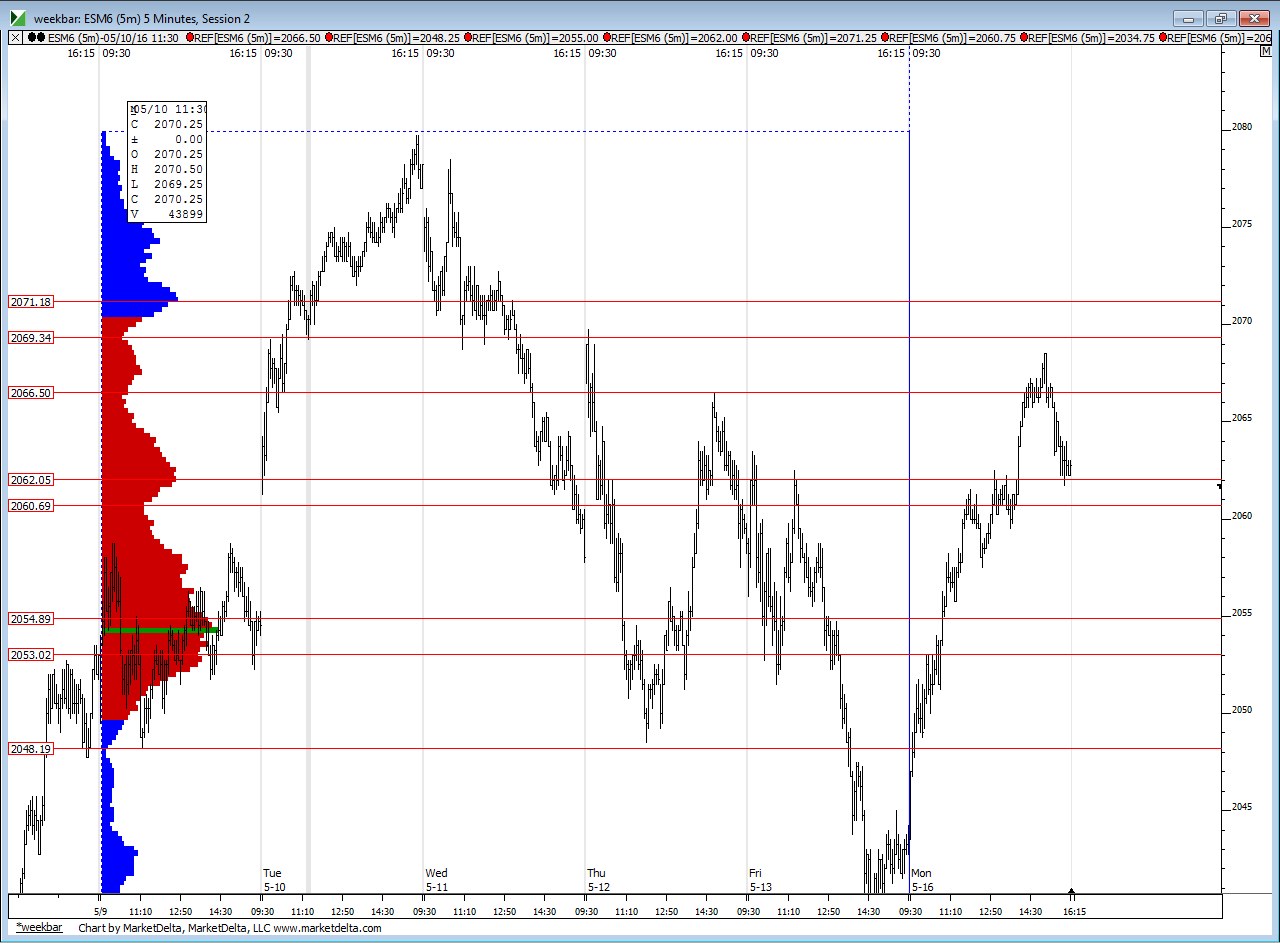
second chart is the SAME chart from Mondays thread showing last WEEKS time profile areas and monday's trade against that ......Mondays areas match up well with areas formed last week. these will be in play again . Lots of the same areas
the best areas will come from areas that saw reactions on Monday from last weeks profile as confluence. We had no overnight midpoint test in Monday's rth so that will most likely be my main focus tomorrow...not planning on posting as I trade as that isn't really helpful and tomorrow I will be trading heavier
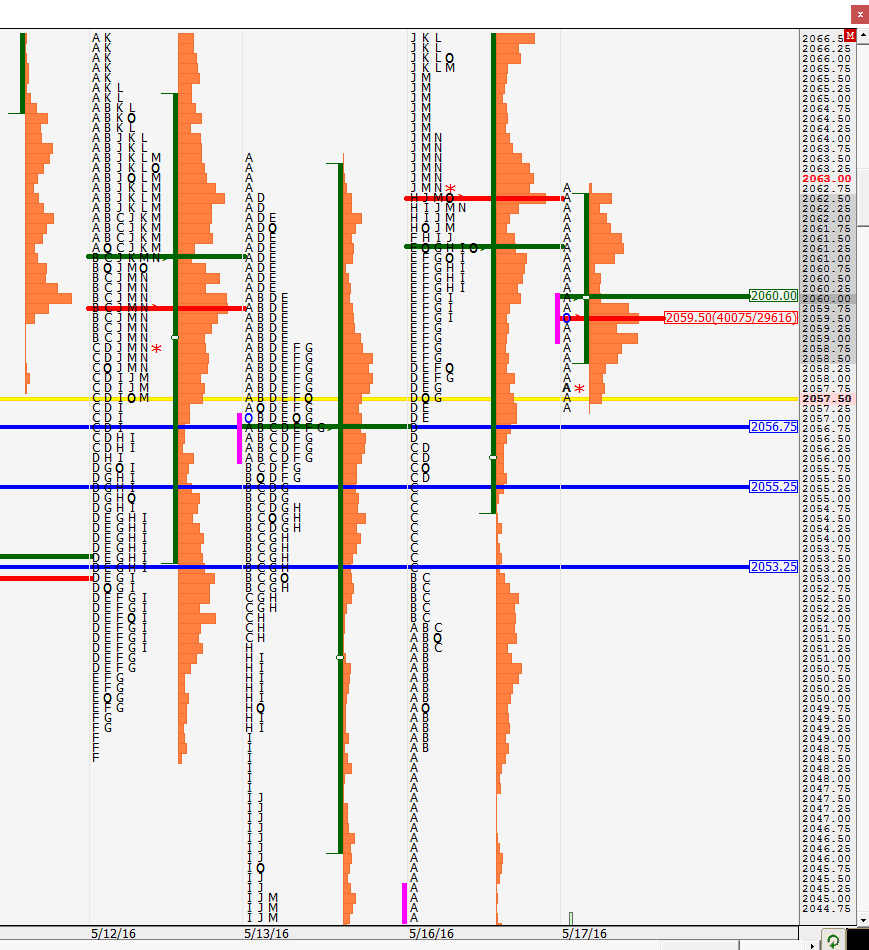
third chart is standard MP chart with Single prints snapped in, Va high and low and POC of time. singles at 56.50 and the pivot number and " price action " spot at 58 area. Closing vwap is there too at 58 .we'll see if the Overnight shines some light on things or confirms some of these areas. Only so many lines we can trade from and having lines every 2 points is unacceptable to be trading from. So these need some refinement ! I'd prefer to have at least 3 - four points between areas otherwise it's just too confusing
,
this last chart compares Fridays trade with Mondays trade. Note how low and high time prices from Friday became low and high time prices on Monday. Sometimes they switch roles ...for example Note how the 2051 and 2061 were low Time on Friday but became High time on Monday !
If I had to summarize all these charts I would be looking at Mondays trade as two separate distributions,,,not evenly balanced.....the top one has low volume/time edges at
2065 and at 2055 - these are the low time spots. Then the center or high time spot of this distribution ( bell curve) is 2060.50
the lower distribution uses the Low time spot of the upper distribution ( trying to make this as confusing as possible) that 2055 as the UPPER edge of it's bell curve and has another low time spot at 2048.50. Then the center and high time of this bell curve is at the 2051 area. So these are the Main areas for me tomorrow and how I will be thinking about price. Now usually when I do charts and ramble the night before we gap far away and all these charts become irrelevant. I hope not for tomorrow. I don't like the 58.50 number and will see if the overnight can make some sense out of that. I'd prefer to play off the edges of the bell curves
Click image for original size
second chart is the SAME chart from Mondays thread showing last WEEKS time profile areas and monday's trade against that ......Mondays areas match up well with areas formed last week. these will be in play again . Lots of the same areas
Click image for original size
the best areas will come from areas that saw reactions on Monday from last weeks profile as confluence. We had no overnight midpoint test in Monday's rth so that will most likely be my main focus tomorrow...not planning on posting as I trade as that isn't really helpful and tomorrow I will be trading heavier
third chart is standard MP chart with Single prints snapped in, Va high and low and POC of time. singles at 56.50 and the pivot number and " price action " spot at 58 area. Closing vwap is there too at 58 .we'll see if the Overnight shines some light on things or confirms some of these areas. Only so many lines we can trade from and having lines every 2 points is unacceptable to be trading from. So these need some refinement ! I'd prefer to have at least 3 - four points between areas otherwise it's just too confusing
,
Click image for original size

this last chart compares Fridays trade with Mondays trade. Note how low and high time prices from Friday became low and high time prices on Monday. Sometimes they switch roles ...for example Note how the 2051 and 2061 were low Time on Friday but became High time on Monday !
Click image for original size

If I had to summarize all these charts I would be looking at Mondays trade as two separate distributions,,,not evenly balanced.....the top one has low volume/time edges at
2065 and at 2055 - these are the low time spots. Then the center or high time spot of this distribution ( bell curve) is 2060.50
the lower distribution uses the Low time spot of the upper distribution ( trying to make this as confusing as possible) that 2055 as the UPPER edge of it's bell curve and has another low time spot at 2048.50. Then the center and high time of this bell curve is at the 2051 area. So these are the Main areas for me tomorrow and how I will be thinking about price. Now usually when I do charts and ramble the night before we gap far away and all these charts become irrelevant. I hope not for tomorrow. I don't like the 58.50 number and will see if the overnight can make some sense out of that. I'd prefer to play off the edges of the bell curves
plan for me today is to be buying below as close to and below 58.50 and also will be using 53 - 54 as additional buy zone...will only use two points as initial target from entry...Midpoint of Overnight will be target in day session but won't be stupid about what went on at the 60.75 line in the overnight
bruce what are SITYS for today?
2071 and 2055 are SITYS
the best way I know of to apply some kind of mechanical entry for your bias are as follows....
On long trades take trades above the first one minute high....this is aggressive and you need to make sure that you don't risk more than 1.25 points and will probably need to try more than once..if needed ...it only takes one good trade to wipe out many small losses
second method...if we drop down first take trades above the high of the lowest one minute bar of the swing down - again you may need to take multiple stabs and you can use the opposite side of the bars as an exit point for both methods too
reverse for shorts
I read that some place else too and he mentioned Mark Fisher's ACD method. Are you familiar with that? I was just reading the free chapter from his book on his website and it stressed on the importance of the opening range. Now whether we define the OR as 1-min, 5-min or 30-min depends on our trading styles, but I found that chapter interesting
EDIT: That and your Pitbull method too came to mind
EDIT: That and your Pitbull method too came to mind
Originally posted by BruceM
the best way I know of to apply some kind of mechanical entry for your bias are as follows....
On long trades take trades above the one first one minute high....this is aggressive and you need to make sure that you don't risk more than 1.25 points and try more than once..if needed ...it only takes one good trade to wipe out many small losses
second method...if we drop down first take trades above the high of the lowest one minute bars - again you may need to take multiple stabs and you can use the opposite side of the bars as an exit point for both methods too
reverse for shorts
Reversal one tic shy of the O/N mid because YD's VPOC was right there at 62.5 as well. The red horizontal line from YD is the VPOC. I would consider this as good enough for O/N mid test. What do you say Bruce?
Click image for original size
ok..not gonna have another babble - athon like yesterday..here is a video I just made about the entry methods I described above...if anyone doesn't understand then please post questions here or in my email etc....there are no stupid questions....just people who are embarrassed to ask questions...which is never good.....hope this helps and gives some ideas....these were one minute bars...I didn't review the video yet but hopefully it will make sense...and make YOU dollars ! My detractors will take this as bragging and I can't stop anyone from having an opinion...so u may not like me or the way I come across on threads etc but don't let it stop you from taking the ideas and making them work for you if you see some value in them for your style of trading
edited this post to follow up with another video to drive home the points
edited this post to follow up with another video to drive home the points
u read my mind...and the close was there so that was good enough and mentioned that on the video....
Originally posted by NewKid
Reversal one tic shy of the O/N mid because YD's VPOC was right there at 62.5 as well. The red horizontal line from YD is the VPOC. I would consider this as good enough for O/N mid test. What do you say Bruce?
Click image for original size
I read that book years ago and it was good..I just can't remember what I "took" from it.....I think this entry method for me was inspired by my first mentor who was inspired by Joe Ross but I'm not sure.....
Originally posted by NewKid
I read that some place else too and he mentioned Mark Fisher's ACD method. Are you familiar with that? I was just reading the free chapter from his book on his website and it stressed on the importance of the opening range. Now whether we define the OR as 1-min, 5-min or 30-min depends on our trading styles, but I found that chapter interesting
EDIT: That and your Pitbull method too came to mind
Originally posted by BruceM
the best way I know of to apply some kind of mechanical entry for your bias are as follows....
On long trades take trades above the one first one minute high....this is aggressive and you need to make sure that you don't risk more than 1.25 points and try more than once..if needed ...it only takes one good trade to wipe out many small losses
second method...if we drop down first take trades above the high of the lowest one minute bars - again you may need to take multiple stabs and you can use the opposite side of the bars as an exit point for both methods too
reverse for shorts
Thanks for the video Bruce and thanks for the comment on Fisher's book. I am planning on reading through the chapter fully and I will see if it sparks anything on my end. I might end up getting his book as well because so far, I have been intrigued by what I read and what you wrote.
bruce your so right on the small losses. yesterday took 7 loss today made it up in one trade. today had two small losses and made ok money on one winner.. i have seen the light of small losses..lol thanks to you and newkid for your post.they are of valve to one person here.
duck
duck
Emini Day Trading /
Daily Notes /
Forecast /
Economic Events /
Search /
Terms and Conditions /
Disclaimer /
Books /
Online Books /
Site Map /
Contact /
Privacy Policy /
Links /
About /
Day Trading Forum /
Investment Calculators /
Pivot Point Calculator /
Market Profile Generator /
Fibonacci Calculator /
Mailing List /
Advertise Here /
Articles /
Financial Terms /
Brokers /
Software /
Holidays /
Stock Split Calendar /
Mortgage Calculator /
Donate
Copyright © 2004-2023, MyPivots. All rights reserved.
Copyright © 2004-2023, MyPivots. All rights reserved.