ES Wednesday 5-18-16
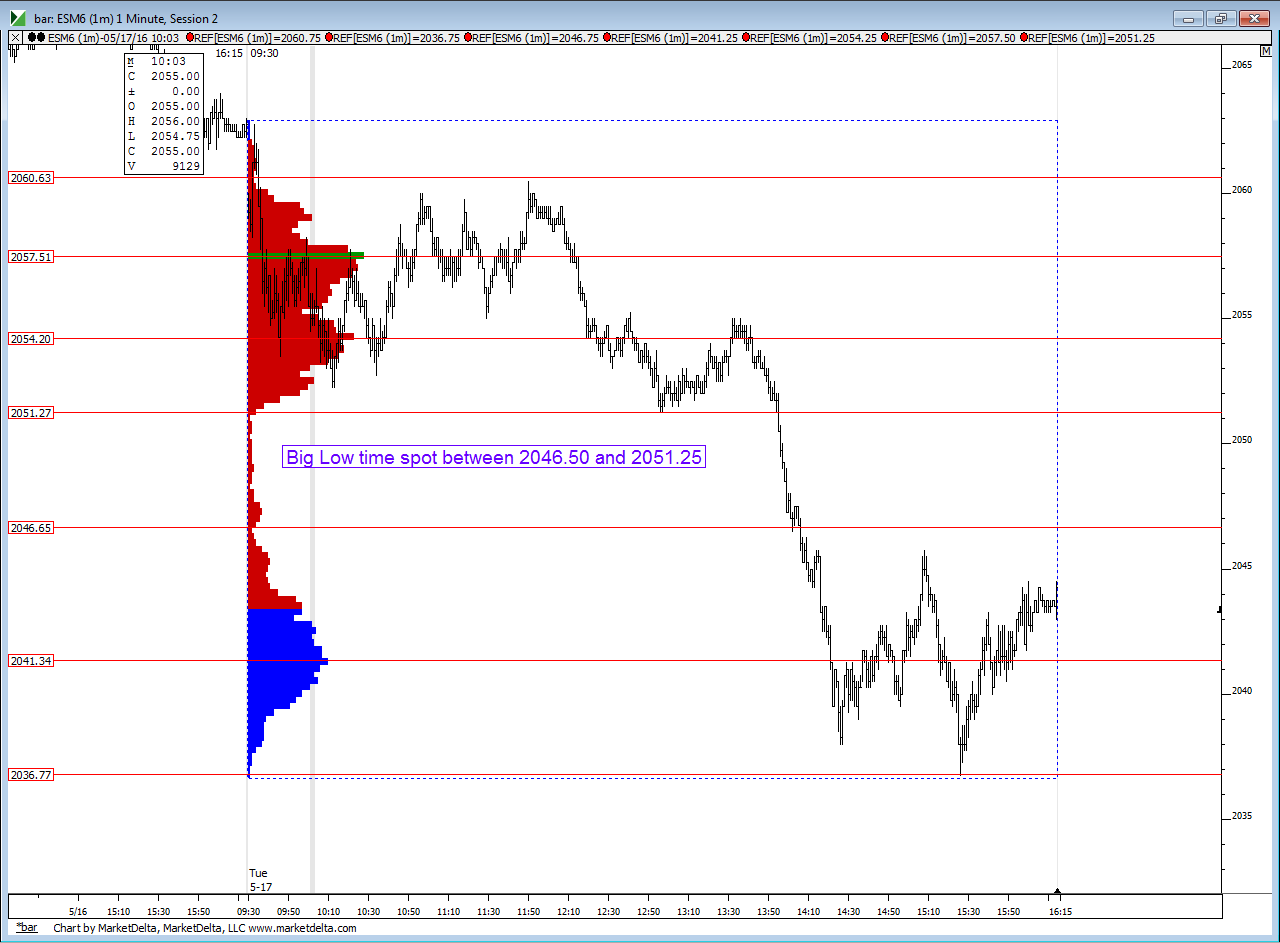
I won't be trading today but perhaps this may help some with their own numbers and areas. Most lines are at least 3 points apart so that is ok...next would be to confirm with your standard MP chart, your day session pivot numbers and the Standard deviation bands. 2054 is still weekly pivot . Once again two different distributions...the upper bell curve is a little sloppy only because we have high time at 54.20 and 57.51
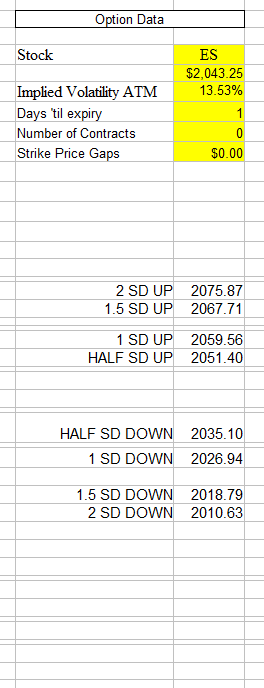
so SITYS are merely the 1/2 SD bands labelled below
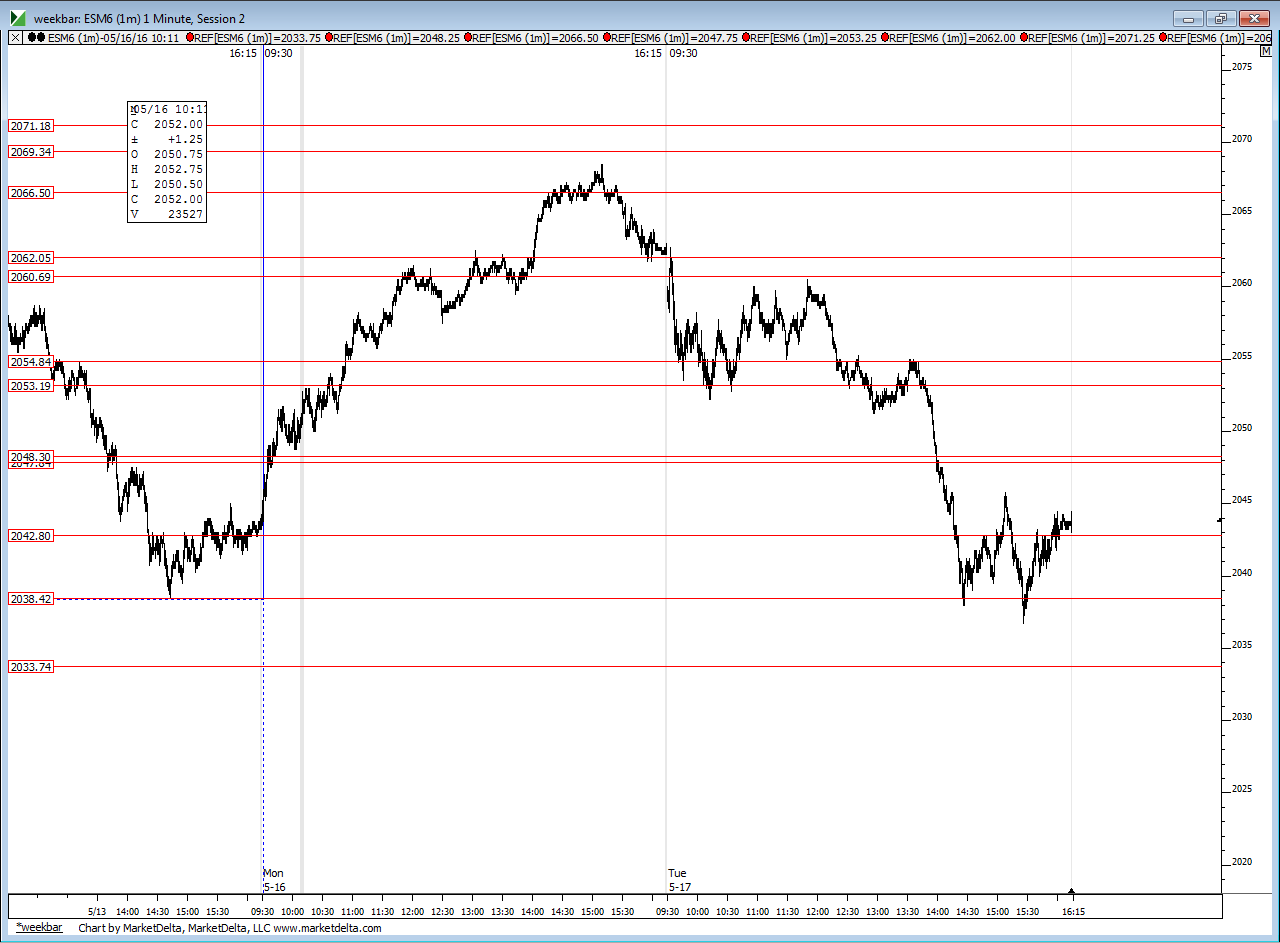
and here is how this week has unfolded against the lines of time created from last week so you could probably use that 46.50 - 48 area as a zone to watch if we push into the Low time zone from today
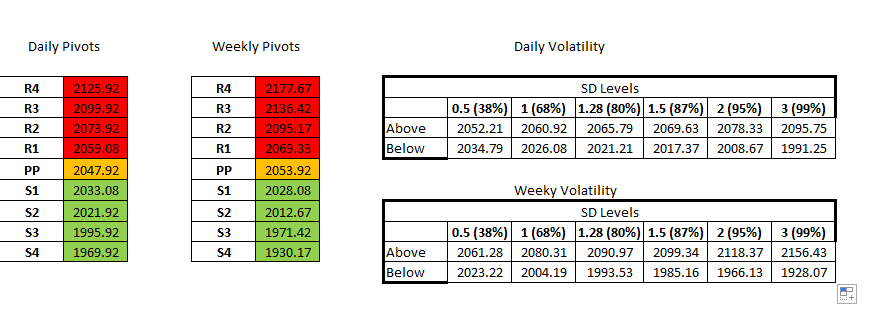
didn't get to the pivots ...good luck on wednesday
Click image for original size
so SITYS are merely the 1/2 SD bands labelled below
Click image for original size
and here is how this week has unfolded against the lines of time created from last week so you could probably use that 46.50 - 48 area as a zone to watch if we push into the Low time zone from today
Click image for original size
didn't get to the pivots ...good luck on wednesday
Here are the pivots and volatility bands. I am not 100% sure on the weekly bands because I need to cross check the calcs with Bruce but here is what I currently have.
Click image for original size
newkid how do you calculate SD levels? these are same number of bruce sitys correct? last question is why are you and his number different?
tia
duck
tia
duck
looks like he used a close of 2043.25 whereas I used 2043.5. I know that he uses the cash close (4 EST) and my data is showing the close as 43.5. That is one source where there is a difference in our data. Secondly, I am using 252 trading days for calculations, and I will have to double check with him on what variables he uses.
As for how I calculate it: Bruce had shown it to me at some point in the past and I have it coded in excel now. Basically it uses the implied volatility data from a website, number of trading days and the closing price to make the calculations. if you are interested, i can dig up the formulae and share them with you
As for how I calculate it: Bruce had shown it to me at some point in the past and I have it coded in excel now. Basically it uses the implied volatility data from a website, number of trading days and the closing price to make the calculations. if you are interested, i can dig up the formulae and share them with you
if it not to much trouble for you. i would like the formula or email the copy of your spreadsheet which ever is easier..it close to the open so take your time..thanks again
duck
duck
if you inbox me your email address, i will shoot it your way in a bit
oil inventories at 10:30 EST so be cautious
IMHO, after the wild swings the past couple of days, the markets will be silent until the Fed minutes and just keep moving sideways. Except for the oil report at 10:30. That is also evident judging by the PA so far
30 min VPOC at 39.25
bruce post these question few days ago.To see if you keep trading. i got them pin up in work area..i like them alot to keep focus.
1) over night high or low broken? yes
2) floor trader number hit? yes
3) over night mid point? yes
4)1 st 30min vpoc? no
5)s.i.t.y.s ? yes
6) break of previous day range? no
so 4 out of 6 means to me time to call it a day.
1) over night high or low broken? yes
2) floor trader number hit? yes
3) over night mid point? yes
4)1 st 30min vpoc? no
5)s.i.t.y.s ? yes
6) break of previous day range? no
so 4 out of 6 means to me time to call it a day.
Emini Day Trading /
Daily Notes /
Forecast /
Economic Events /
Search /
Terms and Conditions /
Disclaimer /
Books /
Online Books /
Site Map /
Contact /
Privacy Policy /
Links /
About /
Day Trading Forum /
Investment Calculators /
Pivot Point Calculator /
Market Profile Generator /
Fibonacci Calculator /
Mailing List /
Advertise Here /
Articles /
Financial Terms /
Brokers /
Software /
Holidays /
Stock Split Calendar /
Mortgage Calculator /
Donate
Copyright © 2004-2023, MyPivots. All rights reserved.
Copyright © 2004-2023, MyPivots. All rights reserved.