ES Friday 10-14-16
Made these on Thursday night so no time for refinement..........wanted some to see how price can often blow through ranges extremes but then come back to test them and second video goes over basic lines for Friday...those need work,,,,
I'm trying to use 35 - 36.50 to get back to the 32 number and the 28 number this morning.....volume spikes in overnight came at 36.50...the R1 for today and at 32...the breakout from YD's highs....already one test of that high.....so I'd like to see another....we have 41 area on upside if we are way off on short fades and buyers take command
Great Videos Bruce..
The one time framing then retracement concept does happen quite often on many timeframes. Understanding when to fade those breakouts is the key. That's where the numbers and other confluence indicators can help.
Was curious what you thought of FT71's Bookmap software? Do you think you could use that as a fader type trader?
Sharks
I didn't get to see it but will be watching the replay either today or before Monday....the previous webinars I have seen looks promising to me...
Originally posted by sharks57
Great Videos Bruce..
The one time framing then retracement concept does happen quite often on many timeframes. Understanding when to fade those breakouts is the key. That's where the numbers and other confluence indicators can help.
Was curious what you thought of FT71's Bookmap software? Do you think you could use that as a fader type trader?
Sharks
What I'd really like to see is a quick push up on the open that breaks the 39.50 high....then have price stall out and see price return to the 39.50 as a target and then the 36.50 as a secondary target ....my other choice is to get a sell at this 36.50 R1 and target the 32 high......I won't be buying OR highs no matter what time frame you define it on.....I WILL however be covering my calls on the open for a small profit......not carrying these over the weekend.....wednesday and Tuesday afternoon have the same highs ....so that could be considered a bracket high at 39.50 and we know we still have that gap in the data at 41 area.....
yesterdays profile is sloppy so I may consider buying puts this morning to see if we can clean up some of that profile....bottom line is that I am not bullish....but doesn't mean I will be on the correct side.....it's friday so will be trading lighter
yesterdays profile is sloppy so I may consider buying puts this morning to see if we can clean up some of that profile....bottom line is that I am not bullish....but doesn't mean I will be on the correct side.....it's friday so will be trading lighter
selling 38 but prepared to work the above the 39.50 if I have to
came out heavy on new lows due to add above that 39.50...trying for official R1 print wathcing that 39.50 high closely///probabilities tell us they will print either 46.5 or 36.5 today based on todays open
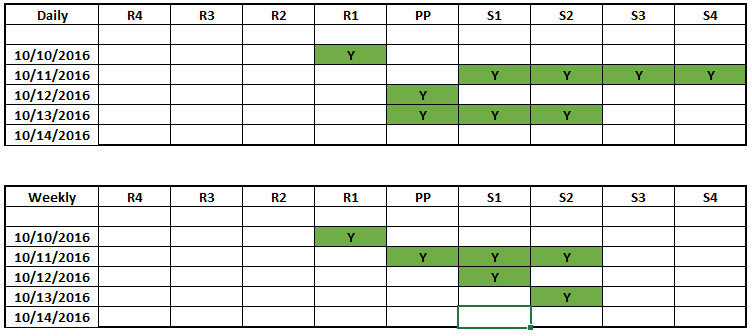
The scorecard so far this week. I find it interesting that we have consistently hit the support numbers but not too many resistance numbers (except for Monday). I have no statistical data to back this up, but does that mean we are due to hit some resistance numbers today? Obviously yes, because whether we hit 36.5 or 46.5, they are both resistance numbers on the daily, but just an interesting thought. Could we have made some estimation after end of day YD?
Click image for original size
41.50 is split between r1 and r2 today...and of course the gap in data area...so even though they didn't just break through the 39.50 I am looking for new sells at 41.50 - 43 ...expecting 39.50 to retest......I have a low...low time node at 43 .......the 41 was nothing more than a gap in data and floor trader split...those donot override price action areas for me
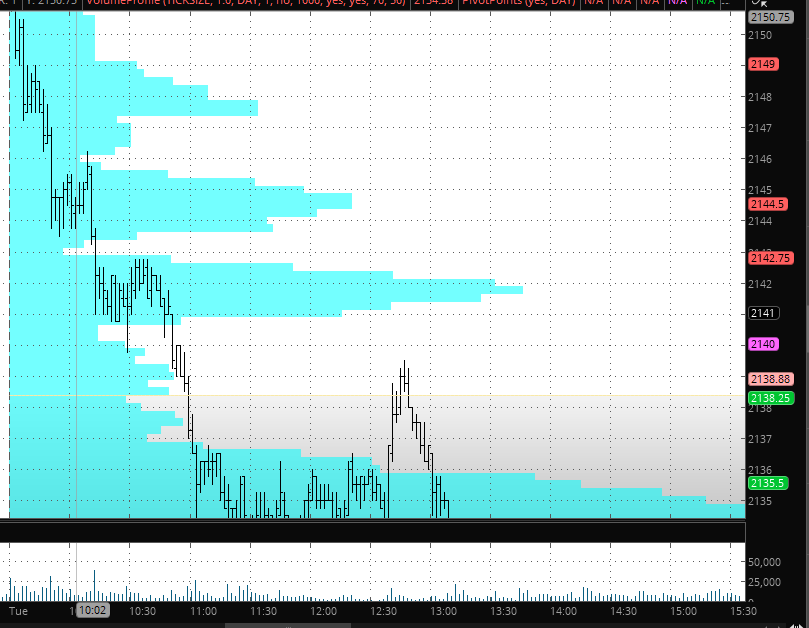
A picture showing the LVN at 43/43.25 that Bruce mentioned. Same idea in terms of volume as well.
Click image for original size

a close up of the low time area at 43 and also shows a high time node at 41.50 from Tuesday....not getting a great feel up here and seems they could pop it up and through quite easy
Click image for original size
Sharks, my apologies.......I was so caught up in the market and replying that I didn't ask you what you thought of it.....hopefully u will see this and if not I will ask on Monday
Originally posted by sharks57
Great Videos Bruce..
The one time framing then retracement concept does happen quite often on many timeframes. Understanding when to fade those breakouts is the key. That's where the numbers and other confluence indicators can help.
Was curious what you thought of FT71's Bookmap software? Do you think you could use that as a fader type trader?
Sharks
Emini Day Trading /
Daily Notes /
Forecast /
Economic Events /
Search /
Terms and Conditions /
Disclaimer /
Books /
Online Books /
Site Map /
Contact /
Privacy Policy /
Links /
About /
Day Trading Forum /
Investment Calculators /
Pivot Point Calculator /
Market Profile Generator /
Fibonacci Calculator /
Mailing List /
Advertise Here /
Articles /
Financial Terms /
Brokers /
Software /
Holidays /
Stock Split Calendar /
Mortgage Calculator /
Donate
Copyright © 2004-2023, MyPivots. All rights reserved.
Copyright © 2004-2023, MyPivots. All rights reserved.