trading application
i chanced upon this site through another forum. your efforts are commendable. i'm somewhat new to volume analysis and would apprciate a quick take on how you would use the information to consider a trading plan of sorts. i.e how and why would you consider a paticular price or set of prices to be key levels? some ideas how you would use this to trade? thank you
regards
regards
Click image for original size
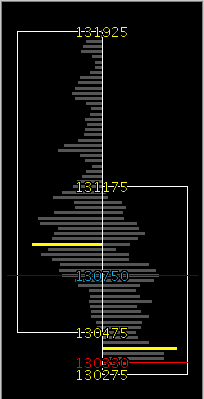
This is the Chart-Ex chart for today for ES showing the Day vs Day. Friday is on the right and Thursday on the left. Friday's profile is not a clean shape bell curve as the profile often is but when it is then you can see where value has been established and the outer bounds of that value where the bell curve tapers off.
The bell curve has been put on its side so not the one that you are used to. The basic theory that is used in practise is that once value is establish the short time frame trader will trade inside value and the longer time frame trader will push the market outside of value. This allows you to establish who is in control.
The basic strategies are to establish 1 standard deviation in the bell curve and short the upper line and buy the lower line until breakout is established and then look to join the breakout direction on a pullback.
Hopefully Lisa will add to this or perhaps give another angle.
Does that help or add more confusion?
Besides the value area that can be easily visualized on chart-ex.com, here are a few strategies that I incorporate in finding entry/exit points for my trading.
1. Compare the H/L/C for the different time frames to get the relative strengh/weakness for the trading day.
2. Use the volumme distribution by H/L for the different time frames to guage the market's demand. You will find alot of times that if there is low volume distribution by the WEEKLY/MONTHLY high/low prices the market has rejected these areas, till the trend changes. (DAILY high/lows need to be confirmed that the H/L were also a new H/L for the week/month.)
3. Use the volume numbers inconjunction with the Pivot,Support and Resistance numbers.
4. Compare the volume distribution for the 3 different time frames. The volume for Thrusday's trading range is light around the highs, but monthly volume for this same area is higher, confirming NOT a rejection area, but you probaly see resistance here as it trys to make new monthly highs.
4. Use the volume distribution with standard bar charts to give you a more indepth view.
I also wrote a few articles that might help; http://www.chart-ex.com/news.jsp
Good trading!!
Emini Day Trading /
Daily Notes /
Forecast /
Economic Events /
Search /
Terms and Conditions /
Disclaimer /
Books /
Online Books /
Site Map /
Contact /
Privacy Policy /
Links /
About /
Day Trading Forum /
Investment Calculators /
Pivot Point Calculator /
Market Profile Generator /
Fibonacci Calculator /
Mailing List /
Advertise Here /
Articles /
Financial Terms /
Brokers /
Software /
Holidays /
Stock Split Calendar /
Mortgage Calculator /
Donate
Copyright © 2004-2023, MyPivots. All rights reserved.
Copyright © 2004-2023, MyPivots. All rights reserved.