Historical Charts Help
These charts will show you what the market did at previous dates and times when the same events happened.
Currently this is available for Economic Events and can be accessed from the Economic Events section of the site. If you are not logged-in then the events page will look something like this:

If you are logged in then you will see historical links to the right of each event like this:

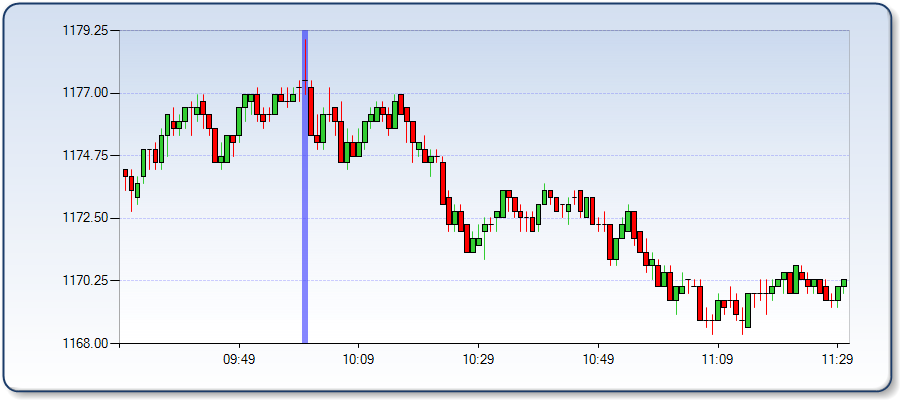
Clicking on one of the historical market action links on that page will take you to a page that will show the most recent charts (up to 20) when that economic event took place. The chart is for the E-mini S&P500 and will span 30 minutes before the event and 90 minutes after the event with each candle on the chart representing a 1 minute time period. Here is an example of the chart from the New Home Sales for 27 October 2010. This is one of 20 charts shown on that page allowing you to see how the market reacted to this event in the subsequent 90 minutes after the event and what it looked like in the preceding 30 minutes. The vertical line shows you when the announcement took place.

Copyright © 2004-2023, MyPivots. All rights reserved.