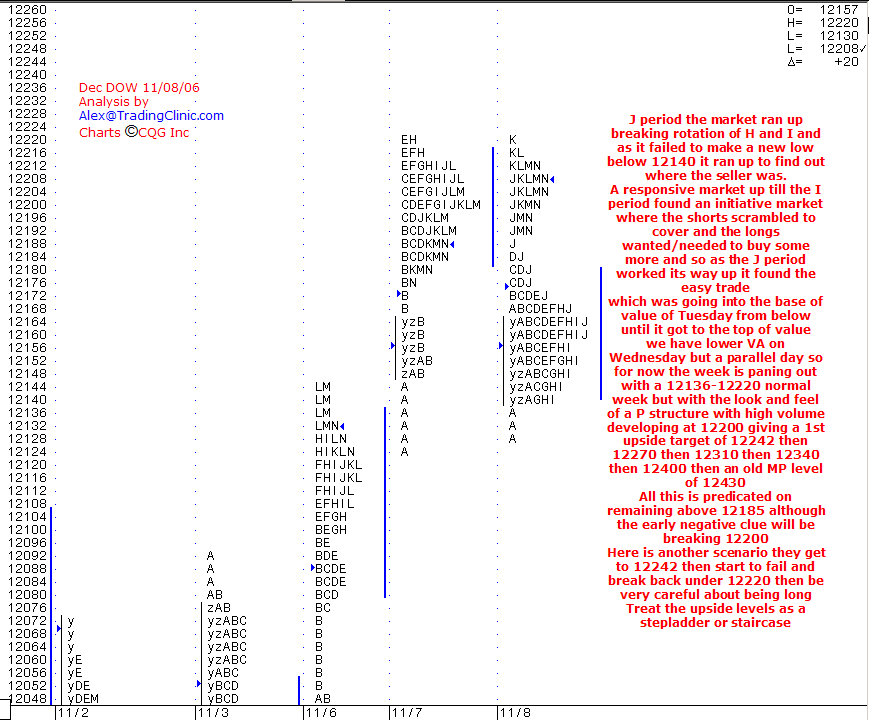
dow nov 8th
Click image for original size
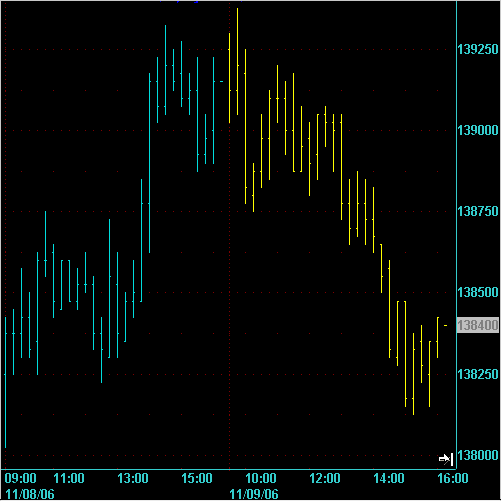
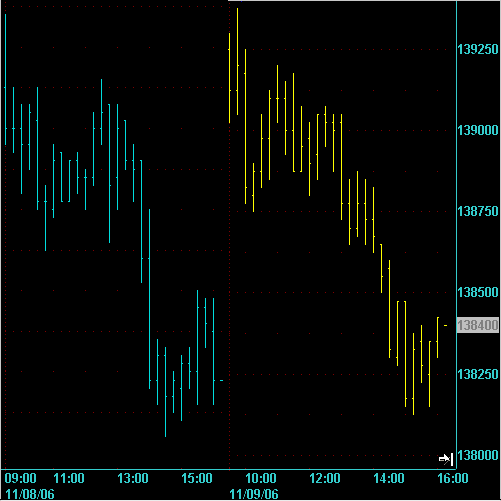
Can you comment on the almost perfect inverse symetry of the Market Profiles from the last two days. What I am saying is that if you put a horizontal line through the chart at about 12174 and rotate one of the days through this line then the two days would look almost identical.
Does this sort of thing happen often? And if it does, what is the significance for Market Profile?
To me it looks like an undecided market.
Does this sort of thing happen often? And if it does, what is the significance for Market Profile?
To me it looks like an undecided market.
I noticed the exact same thing yesterday that you are talking about Elite but I noticed it on the ES (E-mini S&P500) and not on the YM like you guys are talking about. I also noticed it on a bar chart and not on a Market Profile graphic.
I took the ES bar chart from the previous 2 days and the first chart shows the regular chart of what actually happened. The second chart shows the first day of the two days flipped through the horizontal axis in the middle so that you can see how similar they were.
I took the ES bar chart from the previous 2 days and the first chart shows the regular chart of what actually happened. The second chart shows the first day of the two days flipped through the horizontal axis in the middle so that you can see how similar they were.
Click image for original size
Click image for original size
Click image for original size
Hi Alley, Not sure if you also have the text that is on the chart somewhere else that is easy to copy and past below or above the chart as well as on it. I am often looking for stuff on the forum with the search option and will obviously not pick up your valuable comments in they are not also in the post. (Obviously can't search the text on the chart.)
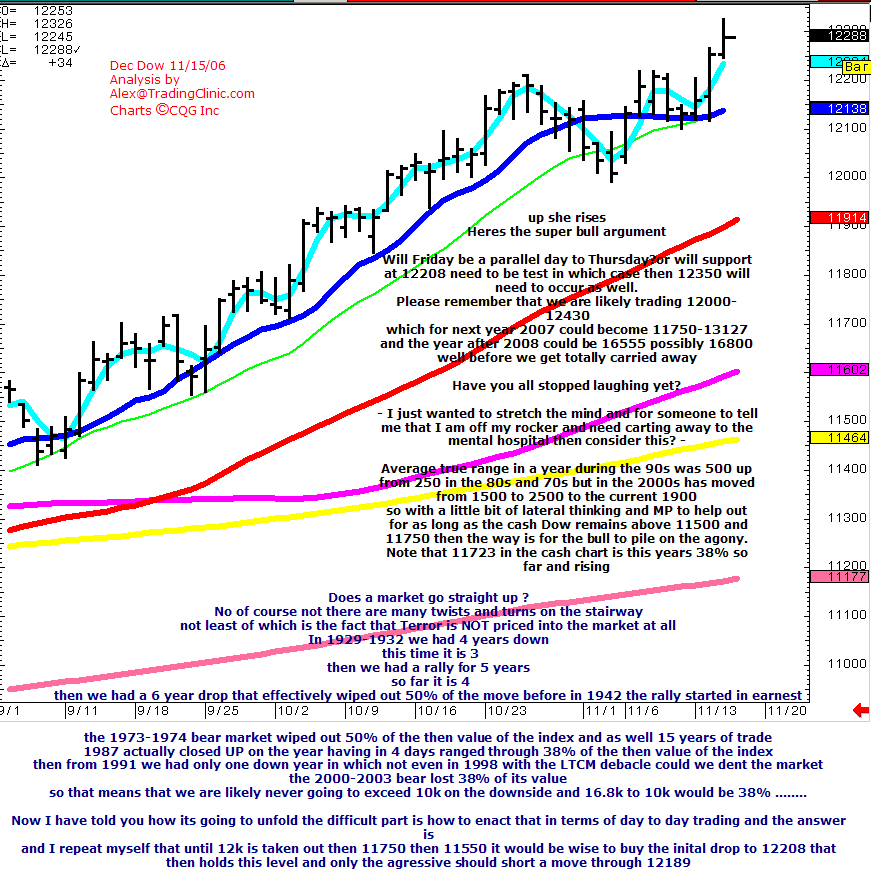
Comments by AlleyB on the Dow Chart from Nov 15th 2006:
Up she rises:
Here's the super bull argument
Will Thursday Nov 17th be a parallel day to Wednesday Nov 16th (corrected text fro I thought yesterday was already Thursday ! lol)
Or will support at 12208 need to be tested in which case then 12350 will need to occur as well
Please remember we are likely trading 12000-12430 (Reference the Futures chart) which next year 2007 could become 11750-13127
and the year after 2008 could be targets as high as 16555 possibly 16800.
Well before we carried away - Have you stopped laughing yet?
I just wanted to stretch the mind and for someone to tell me that I am off my rocker (head) and need carting away to the mental hospital the consider this - ?
Average True Range in a year during the 1990s was 500 up from 250 in the 1980s and 1070s but ion the 2000s has moved from 1500 to 2500 to the current 1900
So with a little bit of lateral thinking and Market Profile to help out for as long as the CASH DOW remains above 11500 and 11750 then the way is clear for the bull to pile on the agony.
Note that 11723 in the Cash Chart is currently this year's 38% so far and of course will rise according to any further advance in the chart.
Dows a market go straight up?
No... of course not... there are many twists and turns on the stairway not least of which is the fact that Terror is NOT priced into the market at all
In 1929-1932 we had 4 down years -- This time 2000-2003 it was 3 years
Then we had a rally off the lows for 5 years -- So far it is 4 --
Then we had a 6 year drop grind lower highs lower lows that effectively wiped out 50% of the move from 1932-1937 before in 1942 the rally started in earnest.
The 1973-1974 bear market wiped out 50% of the then total value of the index and as well blew through 15years of trade.
1987 actucally despite the crash closed P for the year having in 4 ays ranged through 38 of the then value f the indes.
In 1991 we started the real bull that up to 2000 only had 1 down year that was not even dented by the melt down of LTCM in 1998
The 2000-2003 bear lost 38% of its then value so extrapolate all this and it means we are likely never to exceed 10k on the downside and takling 16.8k to the topside means that 10k would be 38% of its value......
Now I have told you how its going to unfold the difficult part is how to enact that in terms of day to day trading and the answer is:
Until 12k is taken out and then 11750 and then 11550 it would be wise to buy the inital nearby drop to 12208 in the days ahead and if this holds the market on a closing basis look for the market to reach high. Only the agressive should short a break-down move through 12189 that mantains closings below 12208 and then 12189 for 12k
quote:
Originally posted by alleyb
Average True Range in a year during the 1990s was 500 up from 250 in the 1980s and 1070s but ion the 2000s has moved from 1500 to 2500 to the current 1900
Is it not better to look at the ATR as a percentage of the underlying because then we can compare year to year or decade to decade on a like for like basis?
in the 70s the annual range represented roughly and rounded 25% in the 80s it had dropped to 15% where it has remained roughly constant to the present day
Thanks Alley!
quote:
Originally posted by alleyb
in the 70s the annual range represented roughly and rounded 25% in the 80s it had dropped to 15% where it has remained roughly constant to the present day
So what is this telling us? That the markets have become less jerky and jumpy in recent times?
Emini Day Trading /
Daily Notes /
Forecast /
Economic Events /
Search /
Terms and Conditions /
Disclaimer /
Books /
Online Books /
Site Map /
Contact /
Privacy Policy /
Links /
About /
Day Trading Forum /
Investment Calculators /
Pivot Point Calculator /
Market Profile Generator /
Fibonacci Calculator /
Mailing List /
Advertise Here /
Articles /
Financial Terms /
Brokers /
Software /
Holidays /
Stock Split Calendar /
Mortgage Calculator /
Donate
Copyright © 2004-2023, MyPivots. All rights reserved.
Copyright © 2004-2023, MyPivots. All rights reserved.