Beginner's Guide to Trading Divergence
One of the easiest and most effective ways to begin trading profitably is trusting divergences that oppose a trend. Here you have several avenues to choose from. You can use a stochastic, an RSI, accumulation/distribution oscillator, price oscillator, ATR, MACD -- the list is endless. What I recommend using is the squeeze as a momentum oscillator with a fast 13/21 EMA MACD overlaying the squeeze. The MACD will outline momentum and evidence weak areas in realtion to the potential divergences.
I like this squeeze:
http://tradersguild.wordpress.com/2007/11/30/squeeze-indicator/
The strategy is simple: what goes up must come down and what stays down while going up, or stays up while going down, must reverse.
Let's look at a few examples.
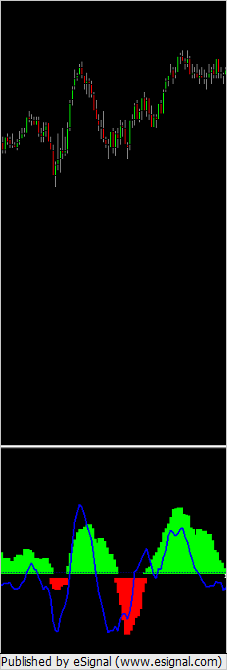
Here's a first against the trend sell signal in the 240 minute chart. Note buyers strength was overextended relative to the prices they were able to reach. Momentum, thus volume, diminished while making a higher high creating weakness sellers exploited.
The opposite is true for buying signals.
Let's change gears and go over a few examples of how divergences can occur without reversing the trend, per se, and continuation divergences in the next few posts.
I like this squeeze:
http://tradersguild.wordpress.com/2007/11/30/squeeze-indicator/
The strategy is simple: what goes up must come down and what stays down while going up, or stays up while going down, must reverse.
Let's look at a few examples.
Here's a first against the trend sell signal in the 240 minute chart. Note buyers strength was overextended relative to the prices they were able to reach. Momentum, thus volume, diminished while making a higher high creating weakness sellers exploited.
Click image for original size
The opposite is true for buying signals.
Let's change gears and go over a few examples of how divergences can occur without reversing the trend, per se, and continuation divergences in the next few posts.
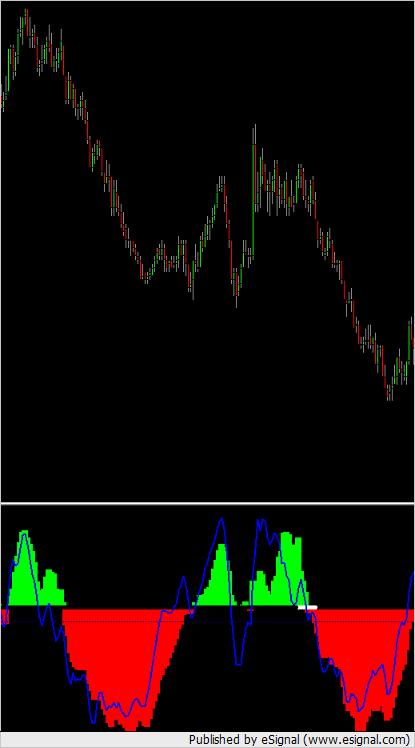
This is heated battle that ended up a reversal. Buyers had a buy signal, attempted to reverse, sellers had a sell signal off of the buy signal, and buyers gained edge in a continuation buy signal.
In a continuation signal the momentum must extend beyond the next highest or lowest peak or trough while remaining lower or higher in price. Filtrate this illustration thoroughly:
In a continuation signal the momentum must extend beyond the next highest or lowest peak or trough while remaining lower or higher in price. Filtrate this illustration thoroughly:
Click image for original size
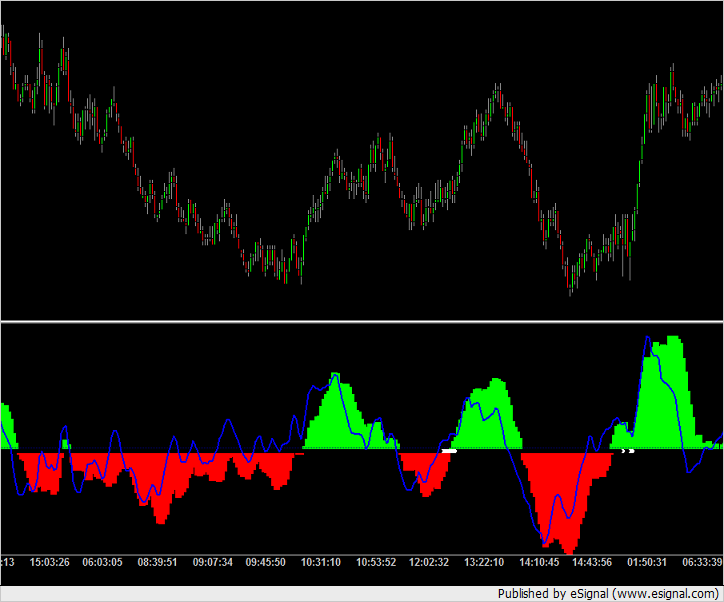
Here's another complex situation.
Sellers moved strong to the downside creating a momentum scalp against the trend. Notice the peak from the excess momentum to the upside was higher than that of the peak from the second to the last movement from the top. That's a continuation sell signal. It went down hard too; but buyers overextended onn momentum weakening and a regular sell signal was formed. There was so much selling volume off of that signal it created another continuation sell signal to seal the deal.
Sellers moved strong to the downside creating a momentum scalp against the trend. Notice the peak from the excess momentum to the upside was higher than that of the peak from the second to the last movement from the top. That's a continuation sell signal. It went down hard too; but buyers overextended onn momentum weakening and a regular sell signal was formed. There was so much selling volume off of that signal it created another continuation sell signal to seal the deal.
Click image for original size
I really don't like not having access to the edit option after 60 seconds BTW. Guy if you can arrange that I can edit my posts that would be great. Thanks.
Here's a classic continuation buy signal, both on a recover from a downward move and the fact that once it recovered it didn't create divergence.
Click image for original size
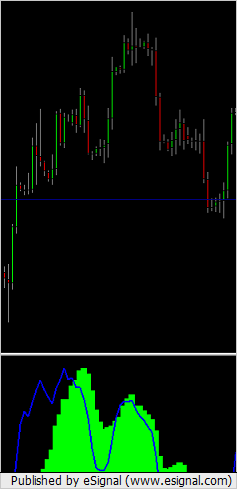
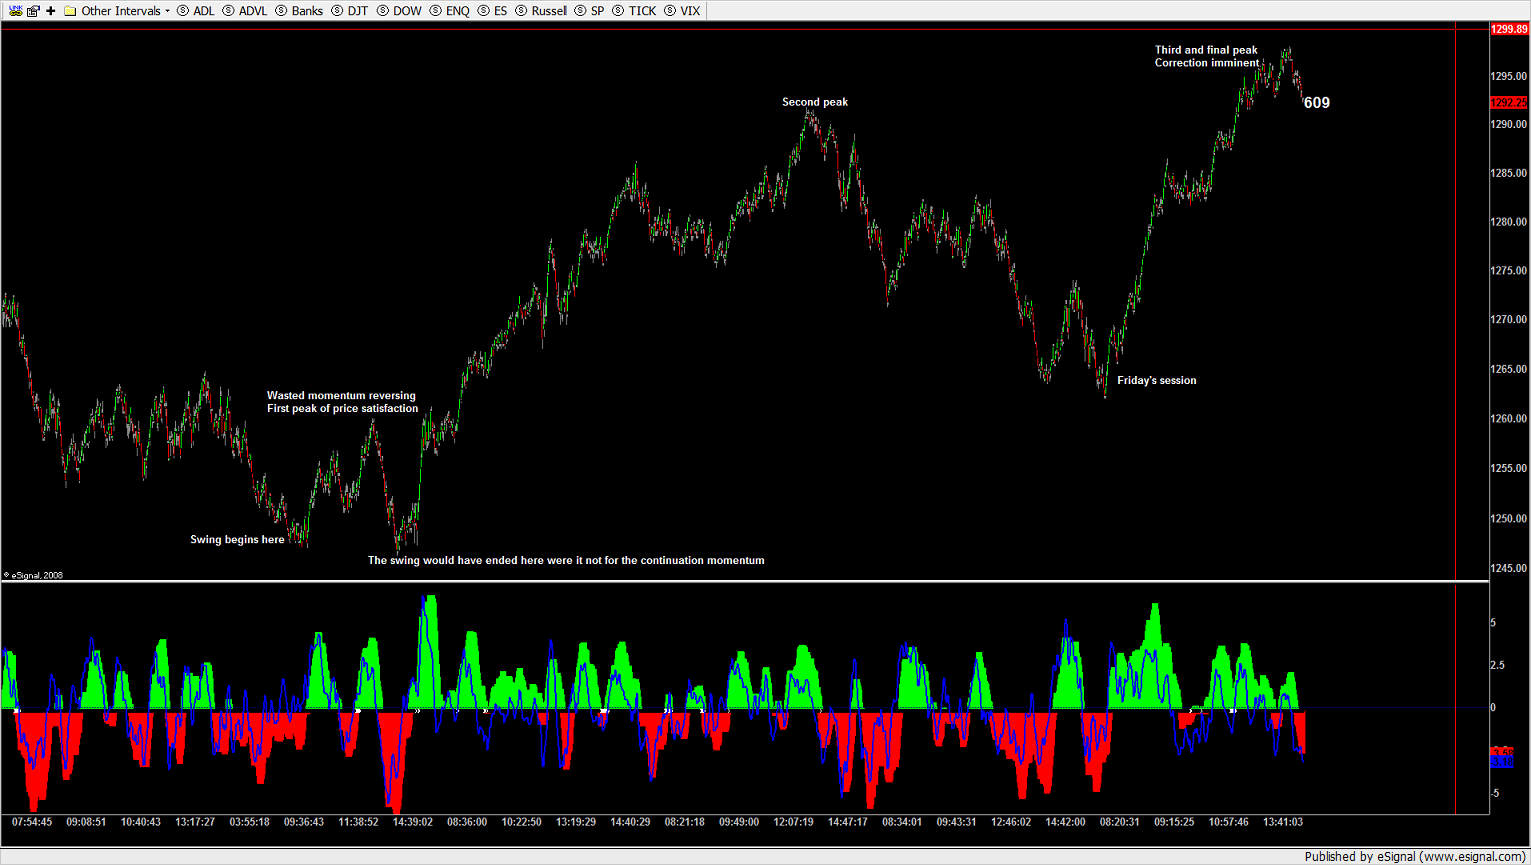
For every trough made in a bull trend and for every peak made in a bear trend, there has to be sufficient distribution of volume for the trend to continue. At each each new peak or trough that needs to be corrected requires pre-existing volume and when that is expended newly added volume. This transfer of power can be seen as a reliable pattern over and over again. From having control to offering it takes three and only three attempts and areas to forge the market with premium price satisfaction. At every peak or trough needing to be corrected volume is borrowed from the preceding support base weakening it until at last all distribution is used unto the beginning of the movement.
If you study the accumulation and distribution in this last bull swing carefully, you'll note not only is it about to end, but the beginning of the swing is nigh meaningless as an area of buying support. I'm not an MP reader but I'ld be willing to bet it turned Market Profile confirms this in ES.
An interesting aside nevertheless.
Study this:
Click image for original size
Emini Day Trading /
Daily Notes /
Forecast /
Economic Events /
Search /
Terms and Conditions /
Disclaimer /
Books /
Online Books /
Site Map /
Contact /
Privacy Policy /
Links /
About /
Day Trading Forum /
Investment Calculators /
Pivot Point Calculator /
Market Profile Generator /
Fibonacci Calculator /
Mailing List /
Advertise Here /
Articles /
Financial Terms /
Brokers /
Software /
Holidays /
Stock Split Calendar /
Mortgage Calculator /
Donate
Copyright © 2004-2023, MyPivots. All rights reserved.
Copyright © 2004-2023, MyPivots. All rights reserved.