Deja vu?
The beginning of the end, or the end of correction?
I was scouring for past charts where SPY/ES behaved similar to what we are seeing now, and here's the closest match that I came up with:
SPY around Feb/07:
http://bit.ly/a029Sh
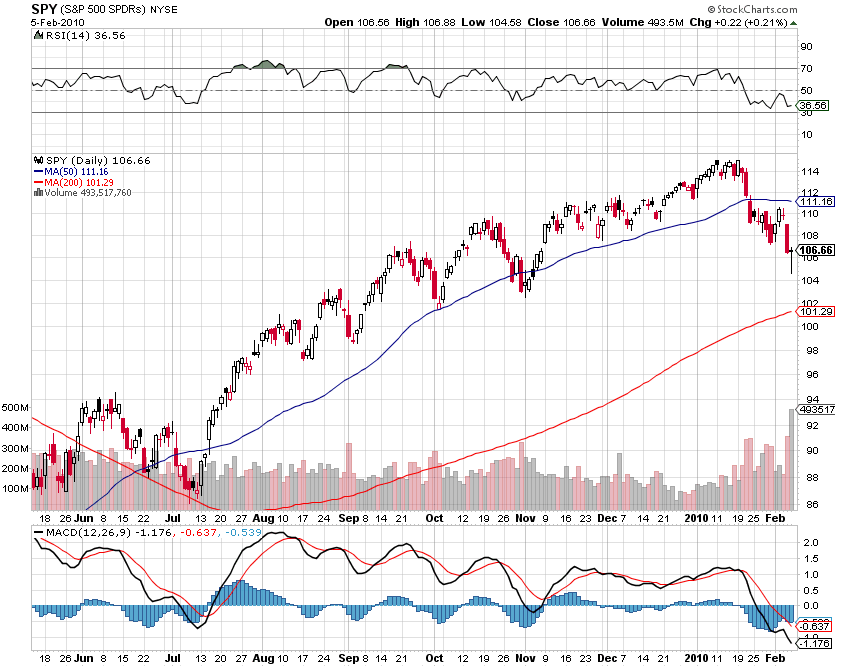
SPY today:
commonalities of current SPY with feb/07:
- 6months run-up prior
- broke below 50d MA/EMA but stayed above 200SMA during the correction
- initial move, followed by a few days of retrace that stayed below 50dMA
- high volume hammer reversal
I recognize that I am building up a bullish bias here, which is why I seek some more objective feedback and comments from all......
I was scouring for past charts where SPY/ES behaved similar to what we are seeing now, and here's the closest match that I came up with:
SPY around Feb/07:
http://bit.ly/a029Sh
SPY today:
Click image for original size
commonalities of current SPY with feb/07:
- 6months run-up prior
- broke below 50d MA/EMA but stayed above 200SMA during the correction
- initial move, followed by a few days of retrace that stayed below 50dMA
- high volume hammer reversal
I recognize that I am building up a bullish bias here, which is why I seek some more objective feedback and comments from all......
and i thought i was the only bull out there. only time will tell.
Emini Day Trading /
Daily Notes /
Forecast /
Economic Events /
Search /
Terms and Conditions /
Disclaimer /
Books /
Online Books /
Site Map /
Contact /
Privacy Policy /
Links /
About /
Day Trading Forum /
Investment Calculators /
Pivot Point Calculator /
Market Profile Generator /
Fibonacci Calculator /
Mailing List /
Advertise Here /
Articles /
Financial Terms /
Brokers /
Software /
Holidays /
Stock Split Calendar /
Mortgage Calculator /
Donate
Copyright © 2004-2023, MyPivots. All rights reserved.
Copyright © 2004-2023, MyPivots. All rights reserved.