CHART-EX WEEK VS DAY CHART
Click image for original size
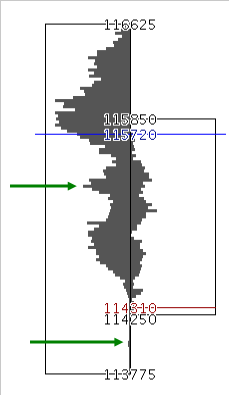
CHART-EX WEEK VS DAY CHART
E-MINI S&P 500 05JUN
The above Chart-Ex chart displays the trading ranges and cumulative volume at price for the time frame;
Week = 4/21 – 4/27
Day = 4/28
As of 10:22 am CST, April 29, 2005, the delayed quote for the E-MINI S&P 500 05JUN is HIGH=1152.75, LOW= 1140.50 LAST=1144.75
The CHART-EX java chart confirms high volume areas at 115.75 and 1140.50. Here is hard to see the volume at the 1140.50 area but if you go to www.chart-ex.com the java applet will show jump in volume around 1140.50
Traders can use historical data to confirm real time support and resistance numbers
Emini Day Trading /
Daily Notes /
Forecast /
Economic Events /
Search /
Terms and Conditions /
Disclaimer /
Books /
Online Books /
Site Map /
Contact /
Privacy Policy /
Links /
About /
Day Trading Forum /
Investment Calculators /
Pivot Point Calculator /
Market Profile Generator /
Fibonacci Calculator /
Mailing List /
Advertise Here /
Articles /
Financial Terms /
Brokers /
Software /
Holidays /
Stock Split Calendar /
Mortgage Calculator /
Donate
Copyright © 2004-2023, MyPivots. All rights reserved.
Copyright © 2004-2023, MyPivots. All rights reserved.