eSignal Market Profile discrepancies
I'm going to use this topic to log discrepancies between eSignal's Market Profile chart and the data/singles that are generated by the DVATool. This is part of my software testing and debugging procedure. If a user questions the differences between (say) the DVATool and the data that they see on eSignal's Market Profile then this is a good point to have a look at examples which may show the differences and why they differ. In a separate topic, eSignal have confirmed this to be a problem for some users (such as myself) and are looking into the problem.
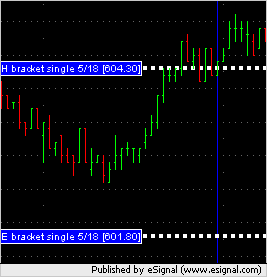
This blue vertical line on the bar chart is the last bar in the H bracket.
This blue vertical line on the bar chart is the last bar in the H bracket.
Click image for original size
Click image for original size

Good news from eSignal is that they believe that the bug may be gone in Build 726 or later of eSignal when it is released. I haven't been given a release date yet but Build 724 is coming out in next few days and it will be the release after that. Here is the thread that I read the above information in:
http://forum.esignalcentral.com/showthread.php?s=&threadid=14042
http://forum.esignalcentral.com/showthread.php?s=&threadid=14042
Emini Day Trading /
Daily Notes /
Forecast /
Economic Events /
Search /
Terms and Conditions /
Disclaimer /
Books /
Online Books /
Site Map /
Contact /
Privacy Policy /
Links /
About /
Day Trading Forum /
Investment Calculators /
Pivot Point Calculator /
Market Profile Generator /
Fibonacci Calculator /
Mailing List /
Advertise Here /
Articles /
Financial Terms /
Brokers /
Software /
Holidays /
Stock Split Calendar /
Mortgage Calculator /
Donate
Copyright © 2004-2023, MyPivots. All rights reserved.
Copyright © 2004-2023, MyPivots. All rights reserved.