Recap
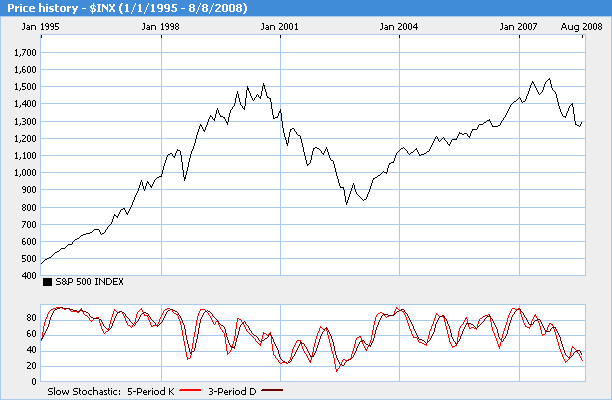
Here's an S&P chart from 1995 to this past Friday. What's noteworthy is that from the peak in August of 2000 to the trough burrowed in September of 2002, didn't have a measured correction. The bull market from Sept. '02 to Oct. '07 was itself the correction. In Elliot Wave Principle parlance it's what's called an irregular ABC correction, where the B wave supercedes the price satisfied at the termination of the 5th wave. The C wave then matches or beats the trough of the A wave. An irregular correction begins a triangle consolidation in the next impulse and eventually will thrust to make new market highs, but not before testing the A wave low. Technically speaking we are in a sub-normal bear market correction within in a bull market. To illustrate that point notice that a bull market divergence was absent in the beginning of the rally of 2002, and in effect the decline from last October was a continuation sell signal on near perfect equilibrium of distribution from the peaks to the trough.
In my analysis this weekend I determined in the ES daily that we have roughly 5% more accumulation to match distribution, which in effect would be enough in its own right to be considered a sell signal. Considering prices were rejected at the 377 EMA in a 4th wave correction Friday at 1298, and that RTH R3 is at 1302, it's safe to assume that accumulation will surpass 5% in volume but not make much way in price increase at the 1300 area despite a likely explosive open to the upside.
Make no mistake about it, this bounce will terminate if not later today then Tuesday after some chop.
Again, I'm targeting 1021.86 for a measured move from 1441 from the 1300 area; and even that wont be a bottom, as you can estimate from the chart.
Emini Day Trading /
Daily Notes /
Forecast /
Economic Events /
Search /
Terms and Conditions /
Disclaimer /
Books /
Online Books /
Site Map /
Contact /
Privacy Policy /
Links /
About /
Day Trading Forum /
Investment Calculators /
Pivot Point Calculator /
Market Profile Generator /
Fibonacci Calculator /
Mailing List /
Advertise Here /
Articles /
Financial Terms /
Brokers /
Software /
Holidays /
Stock Split Calendar /
Mortgage Calculator /
Donate
Copyright © 2004-2023, MyPivots. All rights reserved.
Copyright © 2004-2023, MyPivots. All rights reserved.
