ES Map/Analysis for 10/30/09
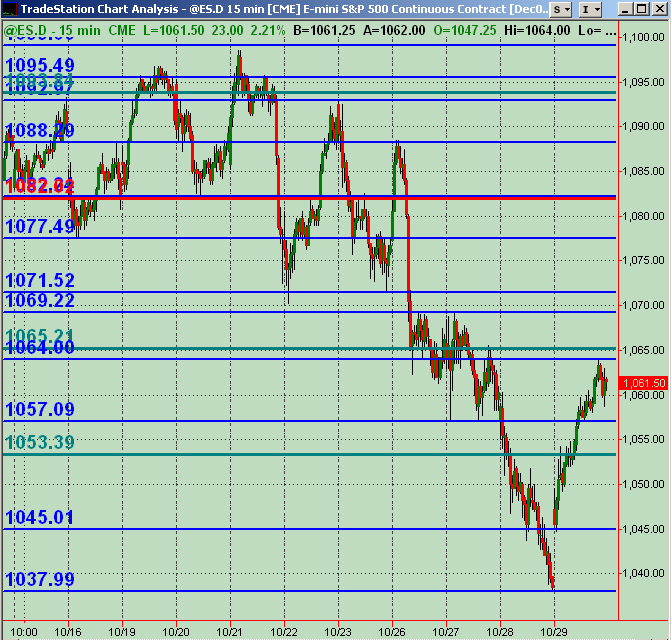
Here's a 15 minute ES chart with the "price action" S/R levels in BLUE ... also have Wkly Pivots overlayed with red being median and green as S/R levels.
Using these prices as "inflection zones" to trade off of based on how price action during the current session unfolds around them. In other words, they can be places to get long OR short (or to take profits on a current position).
Would welcome any and all comments and analysis and additional charts for mapping/planning Friday. The more inputs and varied analysis, the better.
Click image for original size
MM,
thx for the response, and not to worry, it was far from being babble.... Actually some useful tidbits.
thx for the response, and not to worry, it was far from being babble.... Actually some useful tidbits.
Emini Day Trading /
Daily Notes /
Forecast /
Economic Events /
Search /
Terms and Conditions /
Disclaimer /
Books /
Online Books /
Site Map /
Contact /
Privacy Policy /
Links /
About /
Day Trading Forum /
Investment Calculators /
Pivot Point Calculator /
Market Profile Generator /
Fibonacci Calculator /
Mailing List /
Advertise Here /
Articles /
Financial Terms /
Brokers /
Software /
Holidays /
Stock Split Calendar /
Mortgage Calculator /
Donate
Copyright © 2004-2023, MyPivots. All rights reserved.
Copyright © 2004-2023, MyPivots. All rights reserved.