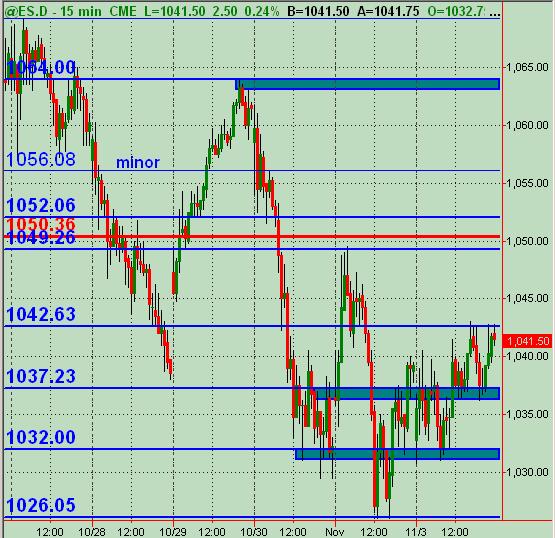
ES S/R Map for 11-4-09
Here's what I've got for potential S/R price action levels/zones (blue lines). The 1056 (and up to 1058) is a minor and "messier" area, but 56 is also the .786 fib rtc back up to the high of 1064 on 10/29/09 ... though I'm not a huge fib fan. My daily chart shows 50sma near 1049. The red line is Wkly Mid-Pvt.
Likely a funky day Wednesday due to Fed. Mkt currently trading at 1044 in night session. Interested in feedback and any other analysis!
Likely a funky day Wednesday due to Fed. Mkt currently trading at 1044 in night session. Interested in feedback and any other analysis!
Click image for original size
Click image for original size
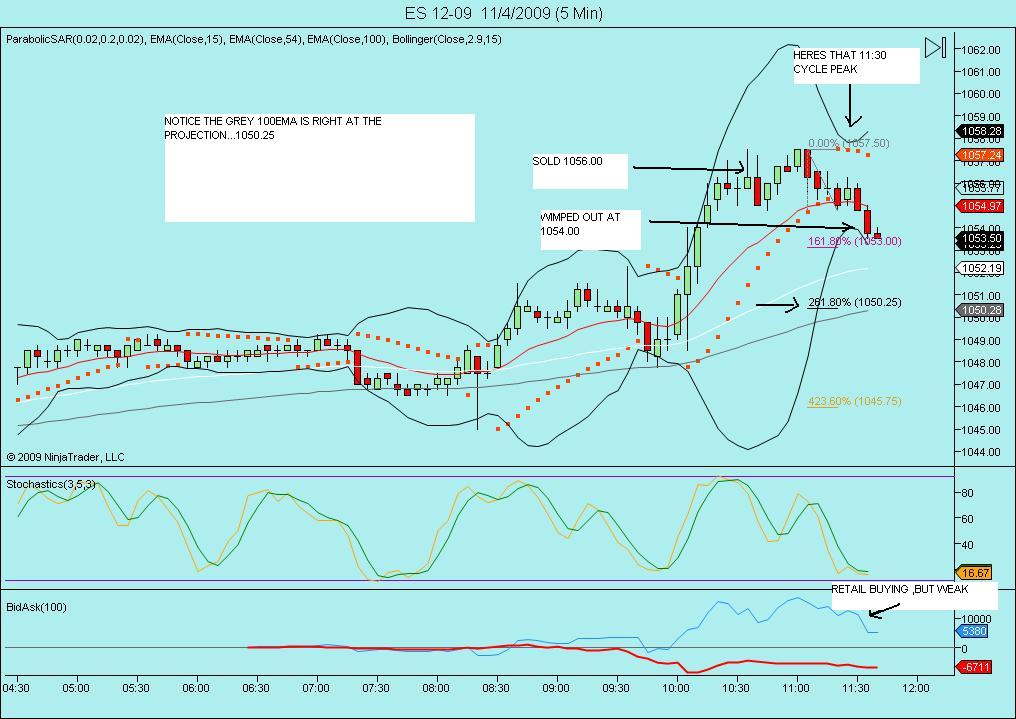
STATISTICALLY SPEAKING ,THE CLOSE THE MARKET IS GENERALLY VERY STRONG FROM THE CLOSE YESTERDAY TO THE LAST TRADING HOUR OF FED ANNOUNCEMENTS!...FWIW
Click image for original size
...THIS IS WHY I WIMPED OUT SO QUICK... PLUS ANOTHER EXPECTED MINI PEAK AROUND NOON
May short a retest of session high for a scalp ... somewhere in 56-57 area ... as long as it happens pretty soon. Getting within a couple of hours of FOMC gig and prefer not to be in mkt during that time.
thanks guys...volume showing double distribution..so i think they will jerk it around a bit in the 51 - 54 area pre announcement.
Agree with both of you ,Monkey and Bruce! i'll actually be a scalp buyer at 1050.50, but definitely out before the announcement!...no heroics here!
No trade for me and on sidelines until post announcement. Gonna get a bike ride in around the lake and be back in time for the fireworks.
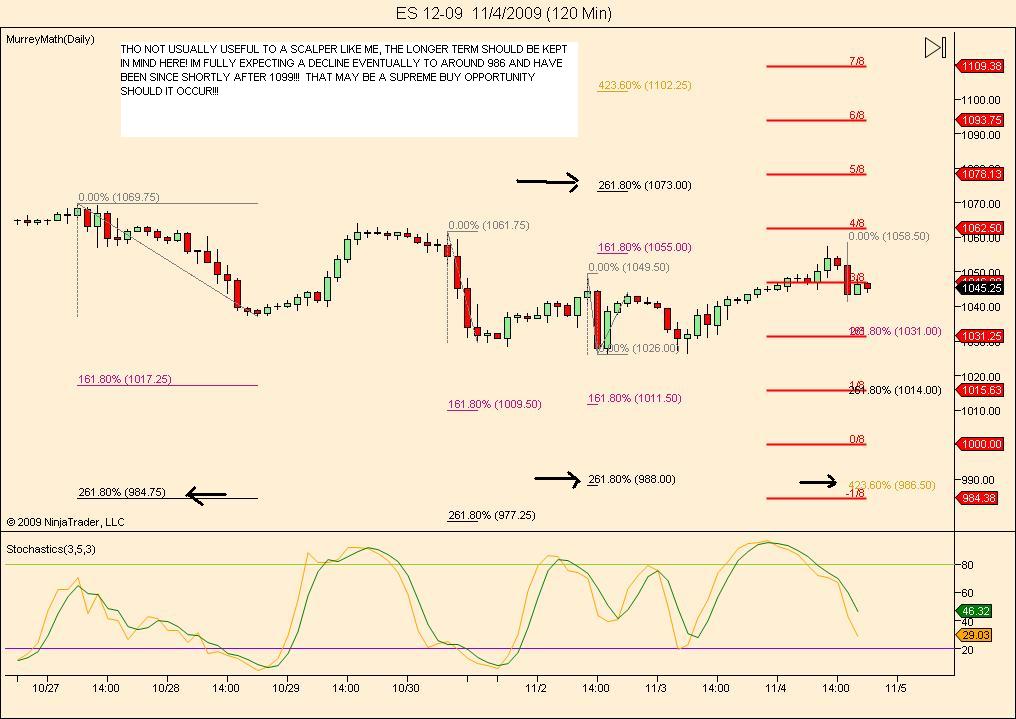
based on gap up open, today I am looking for resistance at 1057 and 1073-74
Thot I'd mention, since not on my initial chart post, if 64.00 gets exceeded, I've got 69.50-71.50 as a zone above [kinda wide at 2 points] w/Wkly R1 near 71 ... and have 77.50 as next signif price up from there ... and it's about time for the fireworks.
LONG FROM 1052
Click image for original size
Emini Day Trading /
Daily Notes /
Forecast /
Economic Events /
Search /
Terms and Conditions /
Disclaimer /
Books /
Online Books /
Site Map /
Contact /
Privacy Policy /
Links /
About /
Day Trading Forum /
Investment Calculators /
Pivot Point Calculator /
Market Profile Generator /
Fibonacci Calculator /
Mailing List /
Advertise Here /
Articles /
Financial Terms /
Brokers /
Software /
Holidays /
Stock Split Calendar /
Mortgage Calculator /
Donate
Copyright © 2004-2023, MyPivots. All rights reserved.
Copyright © 2004-2023, MyPivots. All rights reserved.