Weekend Update - 12/19/09
Click image for original size

Click image for original size
Great analysis and charts VO! Many thx!
Click image for original size

Click image for original size
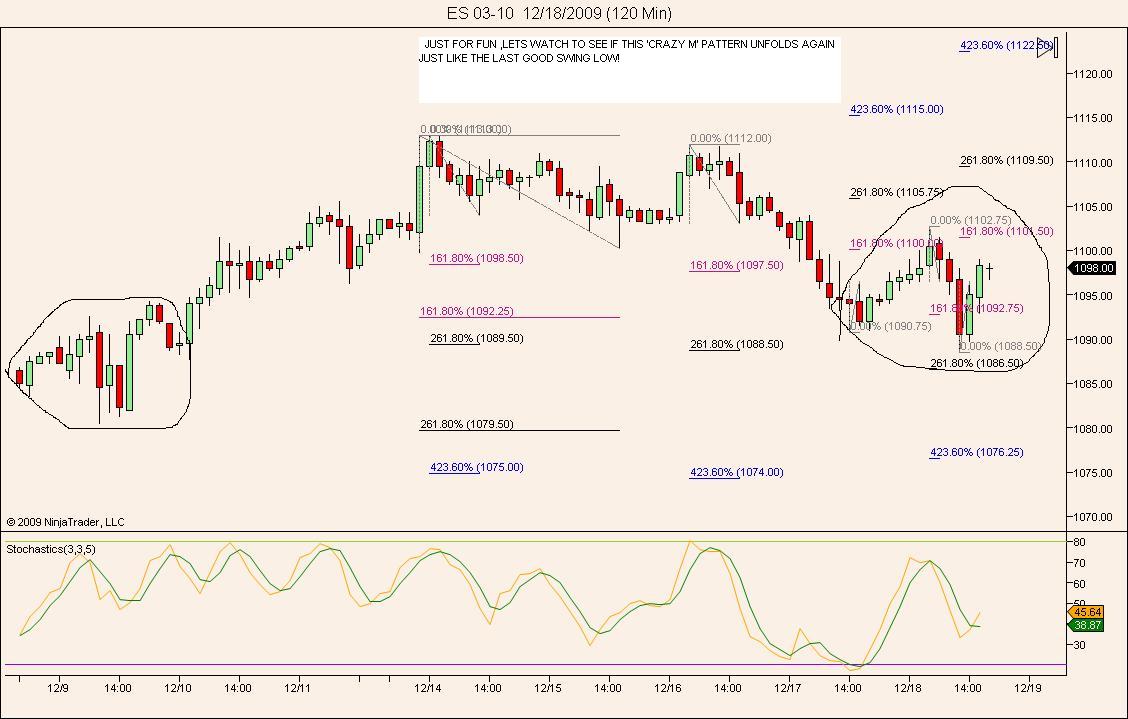
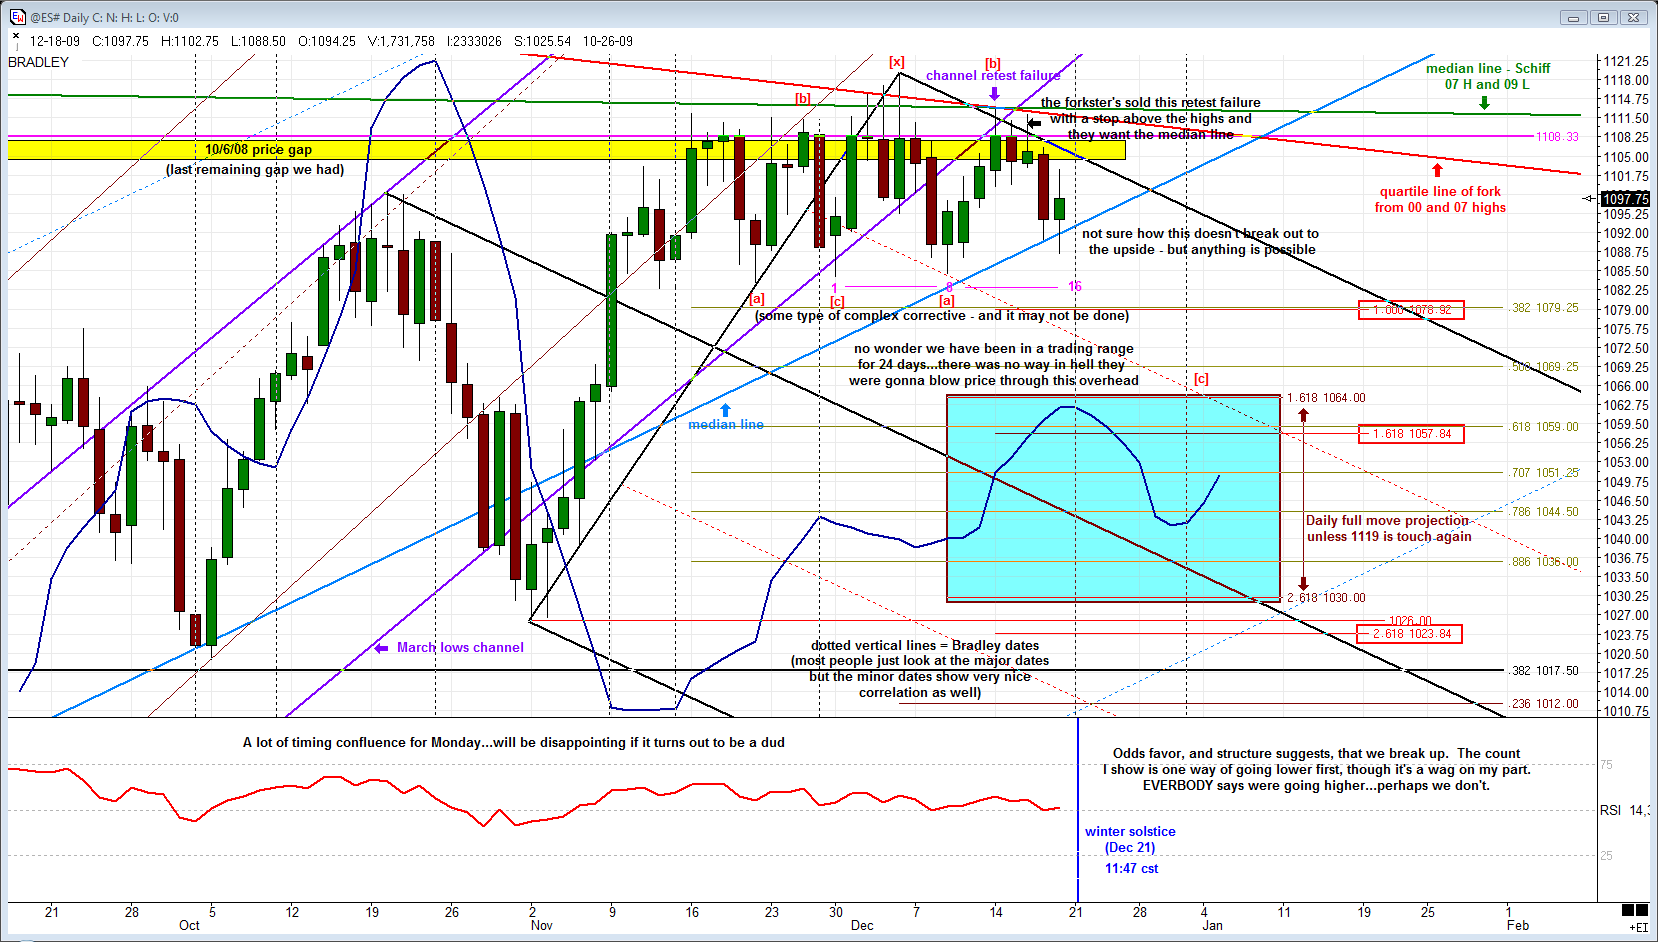
Although i feel we'll see new highs in Jan., i also wonder if the 'correction ' is over yet . Note on VO's second chart, if day #1 is at [x] and day# 7 is the next top at [b] (channel rest high), then wed would be an expected low!
To the weekly page Support Privacy Search Ticker
Not Updated since 12/18/2009 12/20/2009
Home Subscribe Login Indices NYSE AMEX NASDAQ OTCBB TSX CDNX
NASDCOMP
NASDAQ COMPOSITE INDEX
Daily Commentary
Our system posted a BUY-IF today. The previous SELL recommendation was issued on 11.19.2009 (29) days ago, when the index value was 2,176.4. Since then NASDCOMP has gained 1.62% .
A bullish pattern has developed and a BUY-IF alert is issued today. You will see if we erred slightly in the previous SELL signal. A confirmation in the next session may mean that we have underestimated the bullish power of the market. The task is now to confirm the validity of this bullish pattern. We will guide you through this process but the prime star of this game is nobody but you. First you must do your homework. A good starting point may be to keep an eye on after-hours and futures trading to get preliminary hints about the direction of the market. Related news, events, economic data, and the world stock markets should also be closely followed prior to confirmation session.
There are three possible cases of confirmation. You have to follow the next session carefully to check if these cases will hold or not:
The market opens with an upward gap, signaling a bullish sentiment in the first case. Your benchmark will be the opening price. If the prices stay over the benchmark, go long. Any white candlestick with an upward gap is a valid confirmation criterion.
In the second case, the market opens at a level, equal to or below the previous day’s close. The benchmark is that closing price. If prices during the session stay over the benchmark, go long. Any white candlestick closing above the previous day’s close is the second confirmation criterion.
If, however, in both cases, the prices during the session start coming below the benchmark, avoid buying. Sell if you feel a definite tendency in prices to close the day below the benchmark.
The third case of confirmation is rarely observed. The market opens with a big downward gap suggesting a very bearish day, and the day ends with a long white candlestick, but still closing below the previous day’s close. However, such a day satisfies the third confirmation criterion and in this case the closing price of the long white candlestick will be taken as the price of confirmation.
If one of the three confirmation criteria is not fulfilled, or in case of a black candlestick or a doji on the confirmation day, the BUY-IF alert remains valid, however without confirmation and the three confirmation criteria are then sought in the following day. The only exception is the long black candlestick. Any long black candlestick following a BUY-IF alert makes it (the signal) void and invalid.
Do not consider any new short positions given the bullish alert and the recent bullish momentum. Short sellers must cover their positions to prevent further losses, if the market confirms the BUY-IF signal.
Data provided by: End of Day Data
BUY-IF
2,211.7
+31.640 +1.45%
Candlestick Analysis
Today’s Candlestick Patterns:
White Candlestick
Bullish Kicking
Candlestick Pattern
Today a White Candlestick was formed. This represents normal buying pressure.
For more about this candlestick click here.
The last two candlesticks formed a Bullish Kicking Pattern . This is a bullish reversal pattern that marks a potential change in trend. Though it is highly reliable confirmation is still recommended.
For more about this pattern click here.
Click image for original size

SP500
S & P 500 Index
Daily Commentary
Our system posted a BUY-IF today. The previous SELL recommendation was issued on 12.17.2009 (1) day ago, when the index value was 1,106.4. Since then SP500 has fallen -0.36% .
A bullish pattern has developed and a BUY-IF alert is issued today. The task is now to confirm the validity of this bullish pattern. We will guide you through this process but the prime star of this game is nobody but you. First you must do your homework. A good starting point may be to keep an eye on after-hours and futures trading to get preliminary hints about the direction of the market. Related news, events, economic data, and the world stock markets should also be closely followed prior to confirmation session.
There are three possible cases of confirmation. You have to follow the next session carefully to check if these cases will hold or not:
The market opens with an upward gap, signaling a bullish sentiment in the first case. Your benchmark will be the opening price. If the prices stay over the benchmark, go long. Any white candlestick with an upward gap is a valid confirmation criterion.
In the second case, the market opens at a level, equal to or below the previous day’s close. The benchmark is that closing price. If prices during the session stay over the benchmark, go long. Any white candlestick closing above the previous day’s close is the second confirmation criterion.
If, however, in both cases, the prices during the session start coming below the benchmark, avoid buying. Sell if you feel a definite tendency in prices to close the day below the benchmark.
The third case of confirmation is rarely observed. The market opens with a big downward gap suggesting a very bearish day, and the day ends with a long white candlestick, but still closing below the previous day’s close. However, such a day satisfies the third confirmation criterion and in this case the closing price of the long white candlestick will be taken as the price of confirmation.
If one of the three confirmation criteria is not fulfilled, or in case of a black candlestick or a doji on the confirmation day, the BUY-IF alert remains valid, however without confirmation and the three confirmation criteria are then sought in the following day. The only exception is the long black candlestick. Any long black candlestick following a BUY-IF alert makes it (the signal) void and invalid.
We do not suggest any new short positions given the bullish alert. The short sellers should consider covering their positions if the market confirms the BUY-IF signal. Otherwise, existing short positions should be carried.
Data provided by: End of Day Data
BUY-IF
1,102.4
+6.3200 +0.58%
Candlestick Analysis
Today’s Candlestick Patterns:
White Candlestick
Bullish Harami
Candlestick Pattern
Today a White Candlestick was formed. This represents normal buying pressure.
For more about this candlestick click here.
The last two candlesticks formed a Bullish Harami Pattern . This is a bullish reversal pattern that marks a potential change in trend. However, its reliability is low and it definitely requires confirmation.
For more about this pattern click here.
Index Value
Day's Close 1,102.4
Previous Close 1,096.1
Previous Open 1,106.4
Change +6.3200
% Change +0.58%
Volume 2,147,483,000
Index Activity
Day's Open 1,097.9
Day's High 1,103.7
Day's Low 1,093.9
20-Day Close M.A. 1,102.5
50-Day Close M
Click image for original size
I noticed an error on my 2nd chart in regards to the pink cycle. My vertical dotted line covers up the long tail on the Nov. 27 candle. This should be where the count starts. Means that the 8 should be a 9 and this would make Tuesday the 22nd a scheduled potential high date - not Monday. Sorry for the confusion.
Emini Day Trading /
Daily Notes /
Forecast /
Economic Events /
Search /
Terms and Conditions /
Disclaimer /
Books /
Online Books /
Site Map /
Contact /
Privacy Policy /
Links /
About /
Day Trading Forum /
Investment Calculators /
Pivot Point Calculator /
Market Profile Generator /
Fibonacci Calculator /
Mailing List /
Advertise Here /
Articles /
Financial Terms /
Brokers /
Software /
Holidays /
Stock Split Calendar /
Mortgage Calculator /
Donate
Copyright © 2004-2023, MyPivots. All rights reserved.
Copyright © 2004-2023, MyPivots. All rights reserved.