Do you Swing MP
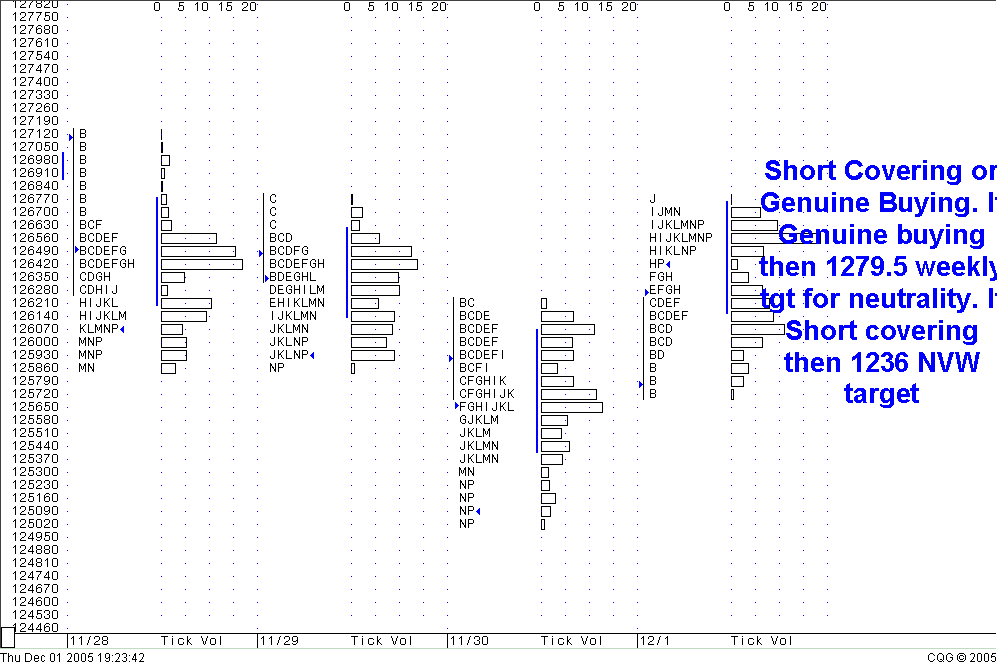
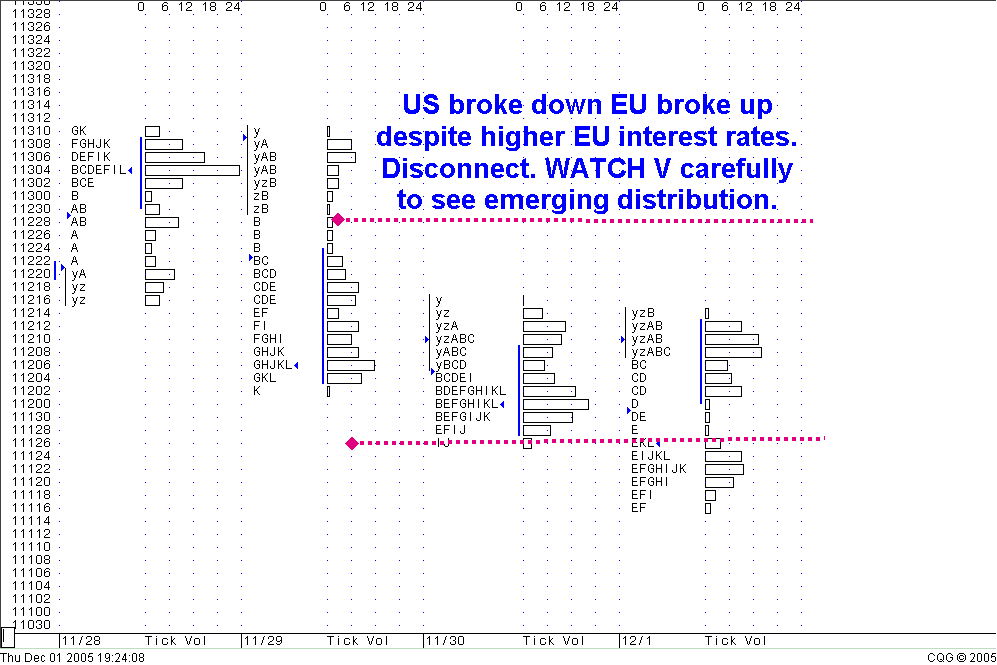
Those are clear and easy to read charts alleyb. How do you identify the Ultra Key and 1st Clue? I have never heard of those terms before today - well at least in the context of Market Profile.
I assume that the first chart that you posted is the ES (or maybe SP) and you mentioned that the second is Bonds.
Thanks for sharing.
I assume that the first chart that you posted is the ES (or maybe SP) and you mentioned that the second is Bonds.
Thanks for sharing.
The 1st chart is the S&P pit session only. The desription is posted top left of chart. PS: who needs the noise generated in the ES off the 23.5 hours. I have to sleep at night and find there is actually sufficient movement during the traditional NYSE trading hours. Apart from which do people really think that the big mutual fund groups like Fidelity or Janus actually trade 23.5 hours. That apart the levels are derived from the profile . 1st clue = entering top of VA. Not good for da bull but da bear needed rotation down through 1255 to gain control of these mega bull mkt that is going up for ever. That is until Monday came about.
Emini Day Trading /
Daily Notes /
Forecast /
Economic Events /
Search /
Terms and Conditions /
Disclaimer /
Books /
Online Books /
Site Map /
Contact /
Privacy Policy /
Links /
About /
Day Trading Forum /
Investment Calculators /
Pivot Point Calculator /
Market Profile Generator /
Fibonacci Calculator /
Mailing List /
Advertise Here /
Articles /
Financial Terms /
Brokers /
Software /
Holidays /
Stock Split Calendar /
Mortgage Calculator /
Donate
Copyright © 2004-2023, MyPivots. All rights reserved.
Copyright © 2004-2023, MyPivots. All rights reserved.

