ES Short term trading 4-20-10
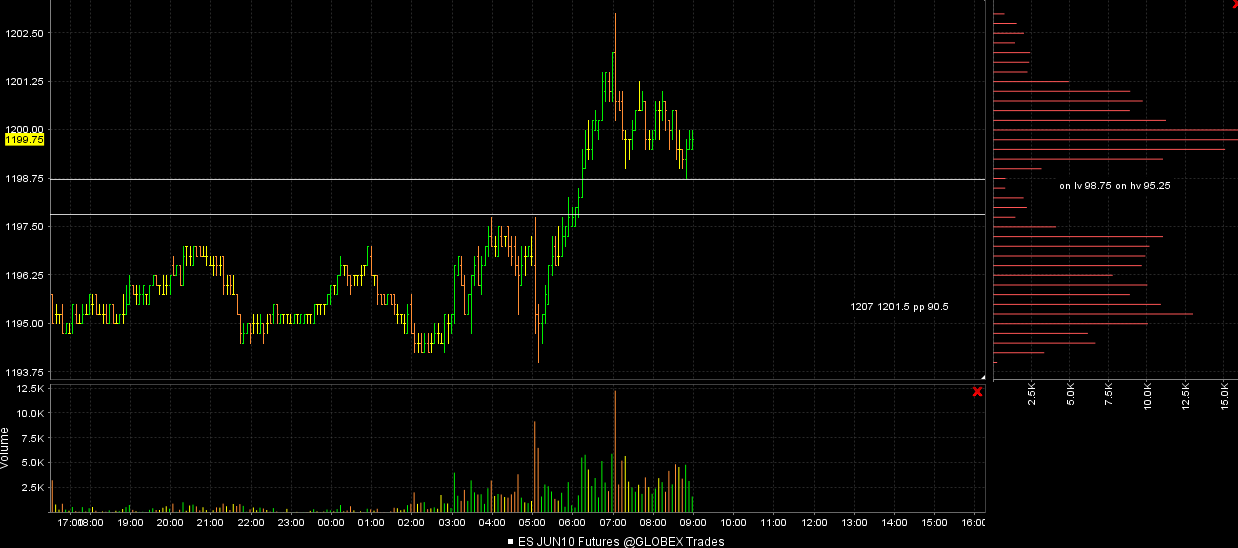
I'm selling anytime we go above 1201 in overnight and day session untill the low volume at 98.75 - 97.75 fills in...this is also the 50 % O/N range which has been a huge target lately
Obvious keys are the ONH at 1202 which is near the R1 today ( nice volumje up there) and up at 1206 - 1207 we have weekly and daily PV numbers....
Down below we have the 94 - 95 which goes well with the weekly PV and the O/N low
Obvious keys are the ONH at 1202 which is near the R1 today ( nice volumje up there) and up at 1206 - 1207 we have weekly and daily PV numbers....
Down below we have the 94 - 95 which goes well with the weekly PV and the O/N low
es really trying to lead this out today higher...but if we look at the key overnight zones in the YM and NQ especially the 11050 - 11055 in YM the struggle becomes more apparent..clearing that and the 2016 - 2017 in NQ could set up the long side...till then the longs will struggle
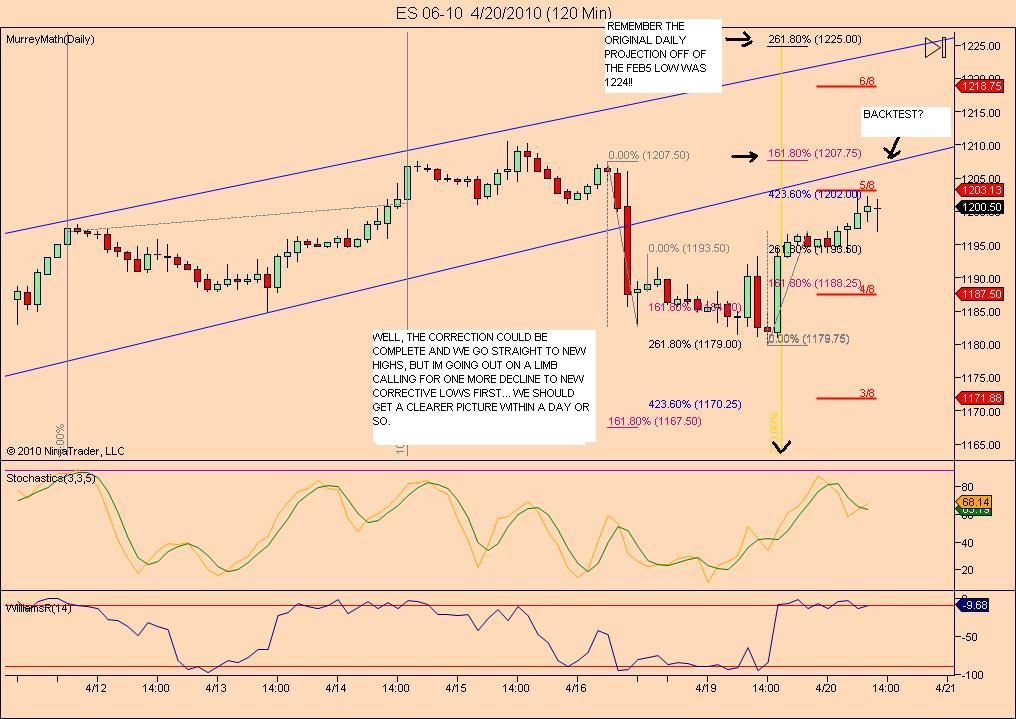
Good morning!..As suspected yesterday, it looks to me like the first leg of a 3 wave decline ended yesterday at 1179.75. now the up leg , and then hopefully , one more down leg (1167?) to finish the correction. this should take 4 or 5 days to play out.My original target for this up leg was (is) around 1205-6 so we are getting close. Remember that i could be completely wrong on all of this scenerio! All im really certain of is that higher highs than 1210.50 are out there. New highs , advance decline, etc at the last high has already clued us in to that.
Market is in balance: 1201.5 has been keeping buyers in check, but sellers can't gain any traction below 1198.
the gap 1196-1195 is becoming more significant.
My bias is to the downside, but I will wait for the break of the range before taking any trades.
AAPL is now 15% of NQ. I think mkt response to aapl earnings tonite will determine whether last Friday's highs is the top, or just another wall of worry to climb.....
Here is what I was using for the overnight short and RTH shorts, the low volume area I mentioned.....What made that area even more important in the RTH session was that we gapped up higher by 5.5 points so 1/2 the gap becomes a great target for the smart traders...that gap target fell right into the 97.75 - 98.75 zone.
ES and YM above the key zones and NQ is trying to bust through but I don't like the symetric look of the profiles which implies they will try and sell rallies so I'm standing aside on any longs still. I also don't like that low in the ES...they get tested a lot....
Click image for original size
ES and YM above the key zones and NQ is trying to bust through but I don't like the symetric look of the profiles which implies they will try and sell rallies so I'm standing aside on any longs still. I also don't like that low in the ES...they get tested a lot....
Click image for original size
A long trade originated at 1198.75 and a short trade has come in force at 1201.25. Both are valid for 4 pt profit with a 4 point SL
Click image for original size

1202.75 should make things more clear
So the long trade is over lets see what becomes of the short trade
I think i'll attempt a short in the 1205.25-1206.25 zone.
I closed this out at 1207.50...perhaps in the morning we will get a better trade
Emini Day Trading /
Daily Notes /
Forecast /
Economic Events /
Search /
Terms and Conditions /
Disclaimer /
Books /
Online Books /
Site Map /
Contact /
Privacy Policy /
Links /
About /
Day Trading Forum /
Investment Calculators /
Pivot Point Calculator /
Market Profile Generator /
Fibonacci Calculator /
Mailing List /
Advertise Here /
Articles /
Financial Terms /
Brokers /
Software /
Holidays /
Stock Split Calendar /
Mortgage Calculator /
Donate
Copyright © 2004-2023, MyPivots. All rights reserved.
Copyright © 2004-2023, MyPivots. All rights reserved.