ES short term trading 5-26-10
Magic numbers today......weekly pivot has not traded yet this week and that is in the 94 area....
1106.25
99 -1100
93.75 - 94****
86 - 87.50
81.25 - 83****
75 ****
68.75 - 70
61 - 62.50
56 - 57.50 ****
1106.25
99 -1100
93.75 - 94****
86 - 87.50
81.25 - 83****
75 ****
68.75 - 70
61 - 62.50
56 - 57.50 ****
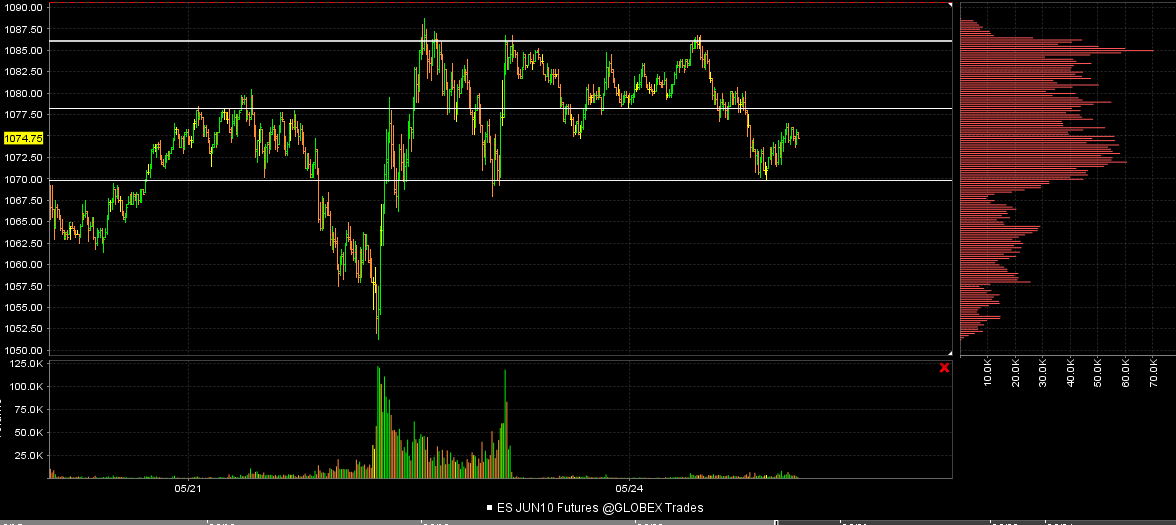
Here is the key range from Monday and fridays range...we need to monitor if we trade above that 1087 area and then get back into the range.....in other words a failed breakout of that range will go back to the center of the range....
Click image for original size
I'm probably early again but I'm starting small shorts at 85.50...ideal target is 81.25
all three covered at 81.25....cool trade....the bulls on that move would try to push it 6.25 points off the 81.25 number up into 87.50....another key number...when they run out of power it will trade back to the first number...
sidelined awaiting 9:30 open....
86 - 87.50 becomes more importnat in RTH if they can hold that high in O/N...
sidelined awaiting 9:30 open....
86 - 87.50 becomes more importnat in RTH if they can hold that high in O/N...
Bruce,
how about that non overlap in the O?N 76.50-76 (near 4am) 5 min chart
how about that non overlap in the O?N 76.50-76 (near 4am) 5 min chart
so what happens if the 81.25 number doesn't act as support ?
The 75 will print !!
Hopefully someone can see the value in this madness....and incorporate the concept into their trades.....
The great thing is that the numbers NEVER change!! A fairly bold statement even for me...!! Biggest lightbulb I've had in a while...
EDIT: What happens if it acts as support again ? Then they will go print 87.50.....I'm not presenting this as a stand alone trade...it is for the concept only...
Paul, my O/N starts at 4:30 e.s.t..so we have traded that area many times so there is overlap there...perhaps I'm confused with your question..
but if we look at the histogram then not much time has traded there and they seem to be blowing through that 75 number easily so I think we will see that area again but I have some things to do before RTH opens.
but if we look at the histogram then not much time has traded there and they seem to be blowing through that 75 number easily so I think we will see that area again but I have some things to do before RTH opens.
my bias is downside until at least 75 prints...if it does...LOL1
careful if long on a 15 minute breakout long today.....they will try to sell rallies and I think we should to....consolidation possible up here....get your money early and trade light....
Bruce, do you even look at price that occurs prior to 4:30?
here's an update of my studies of the overnight PA:
I went through the past 22 trade days
1st premise was if AH closes above 50% of previous day's AH range, then current AH H will be taken out first in RTH and if close of AH below 50% of prior day's AH range, then current AH L will be taken out first
this premise was true 63% of the time in the past 22 trade days.
I looked at the days when AH close was above 50% of prior day's AH range BUT, RTH did not take out H first (or vice versa), on the AH chart, I noticed swing failures and there were 2 occurrances (in the past 22 trade days) when the AH target was missed by 1 tick, those rejections resulted in good sized legs.
looks there is some art involved when it comes to interpretting these measures of the AH... but the raw 63% for all cases is not just a coin flip. I am still farming the data.
looks like that retest of the AH DT could be a wyckoff thrust.
I think most are refering to the fact that the market has a short term memory and so they watch the swing highs and lows to see if price gets accepted ( spends time) above or below these key areas...
when I think of price action I think of higher highs and higher lows for an uptrend and LL and LH for a downtrend....
there are so many ways to trade so it may not be the best way for everyone...I fade moves so some may be buying a new swing high, where I'd be looking to fade it...usually....
I wish more would chime in with a reply
Originally posted by feng456
Man i've been hoping for short alllllllll morning too. I hate trend days.
So I have a quick yes or no question. When people talk about price action and how knowing it is the 'only' way to trade, do they mean like 'oh it's likely that the price will bounce off of this last 30 minute high' because they know from previous experiences? or am i completely off...
Emini Day Trading /
Daily Notes /
Forecast /
Economic Events /
Search /
Terms and Conditions /
Disclaimer /
Books /
Online Books /
Site Map /
Contact /
Privacy Policy /
Links /
About /
Day Trading Forum /
Investment Calculators /
Pivot Point Calculator /
Market Profile Generator /
Fibonacci Calculator /
Mailing List /
Advertise Here /
Articles /
Financial Terms /
Brokers /
Software /
Holidays /
Stock Split Calendar /
Mortgage Calculator /
Donate
Copyright © 2004-2023, MyPivots. All rights reserved.
Copyright © 2004-2023, MyPivots. All rights reserved.