ZigZag Indicator over last 2 days
This has worked for me, for two days
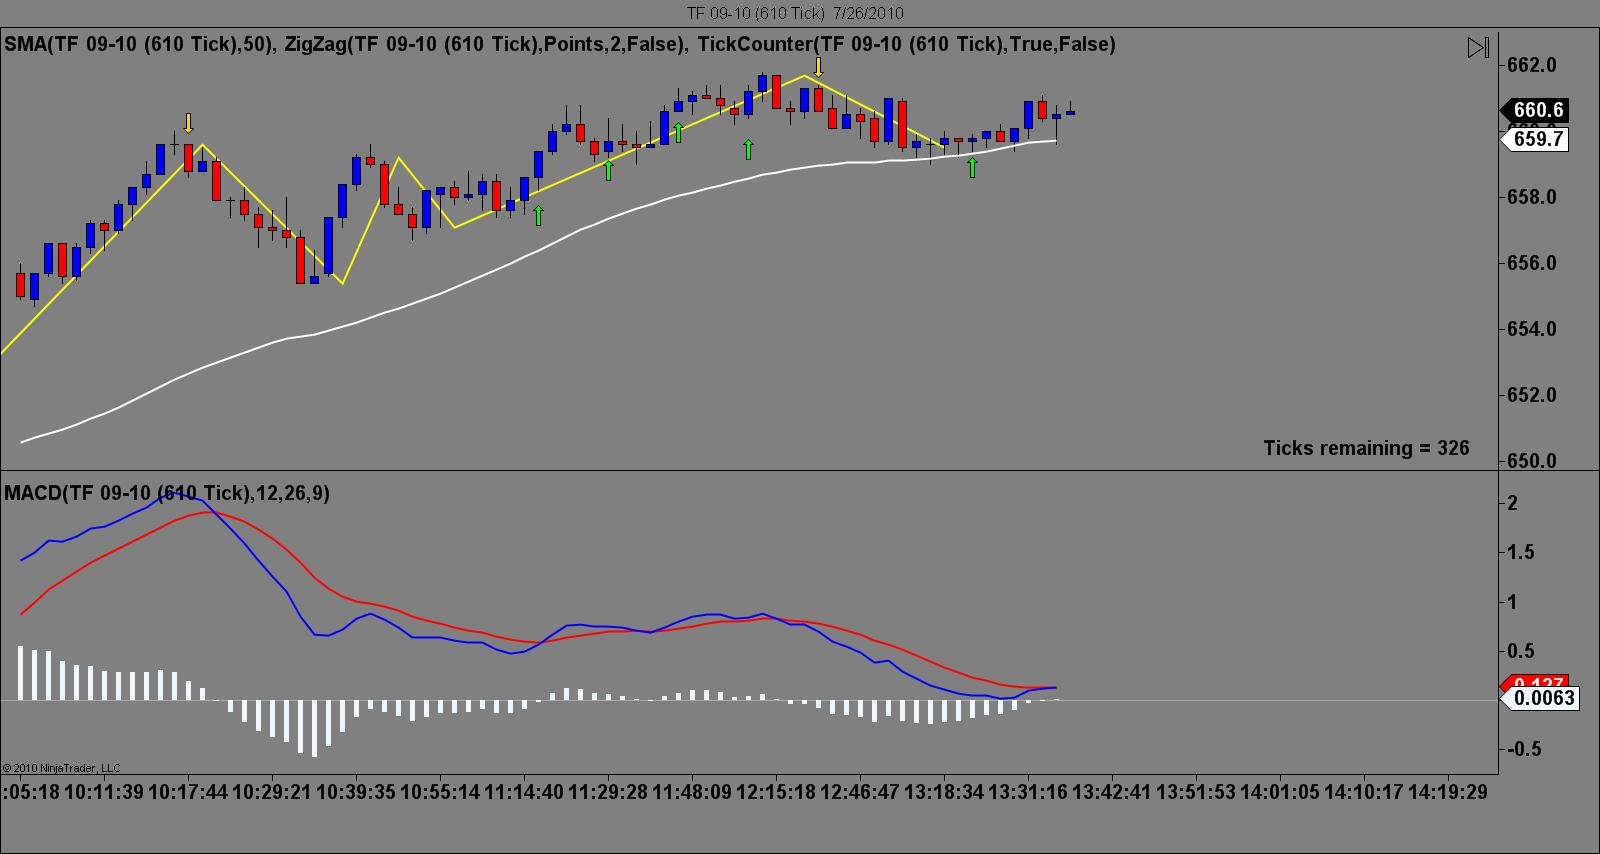
Ok well I'm going to post these charts just to get any feed back. I'm using the "ZigZag" indicator. I had never really used it because I thought it did not confirm the swings till maybe two or three plots into the current line being drawn. Turns out that it does not plot a line till price is turning. I watched it all day today, and I only saw one instant where the line ploted, and prices continued up, instead of turning around. But prices did turn very shortly their after.
In the first picture you see the green arrow around 13:20. Thats where I went long at, and you can see that the line has printed, confirming a pivot or swing. Now that combined with a MACD, and a 50ma and a 200ma worked very well all day.
All and all I just wanted to go long today, because the 50ma was above the 200ma. However we all know you can get in great shorts on bullish day. So the two short trades you see where just that. Those where places I thought it might sell off at, I used the "ZigZag" indicator to confirm it, and I was right. Yah for me!
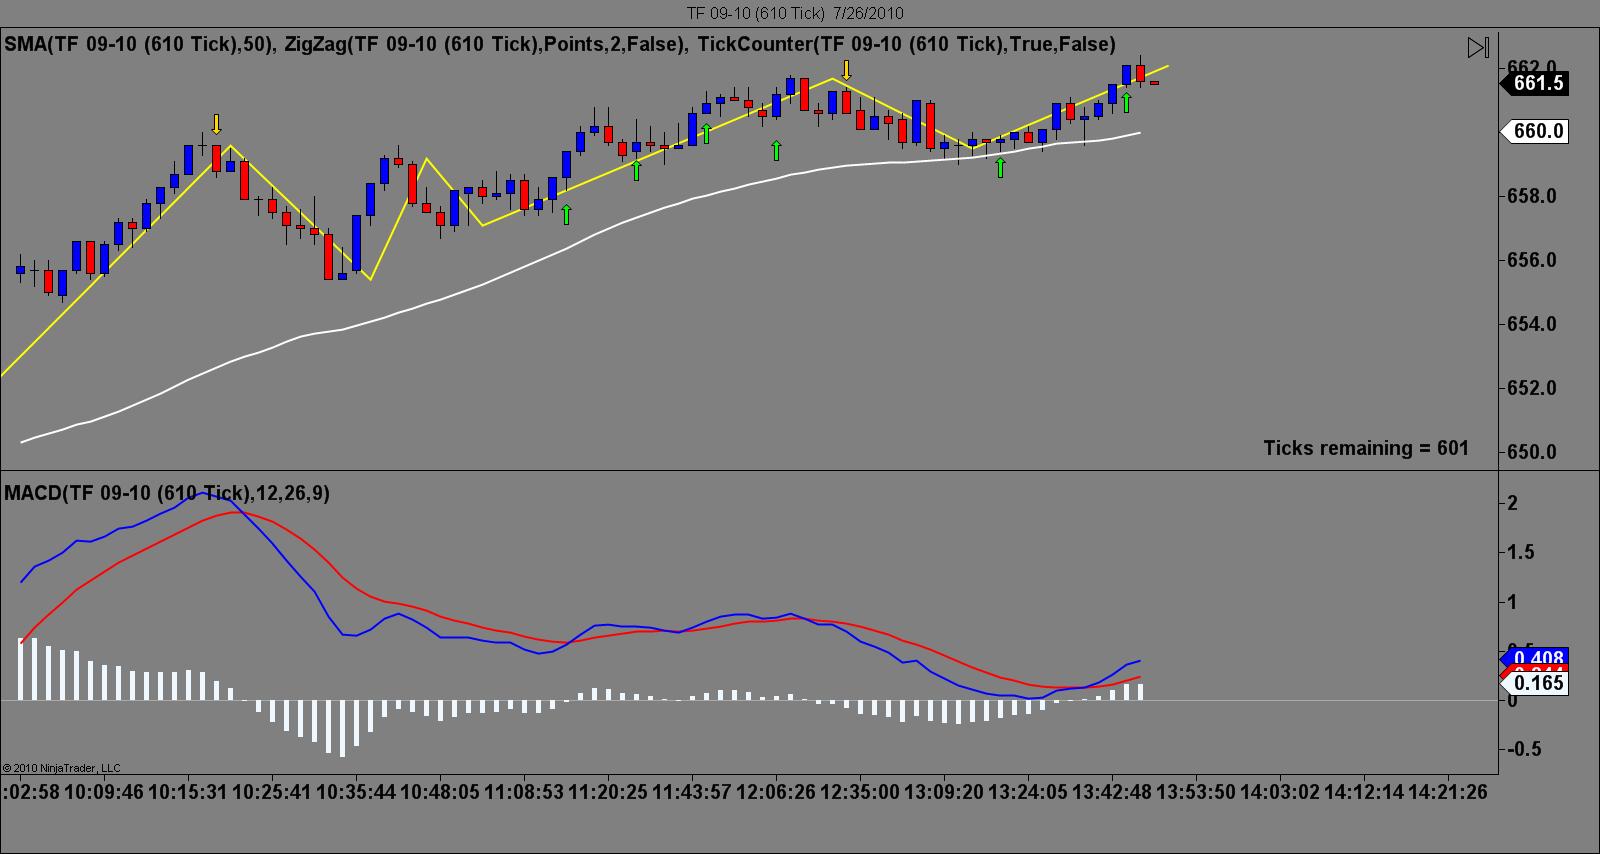
In the second picture you can see that I went long again at about 13:42. Now I had already made a point from the first long at 13:20. So as soon as that blue candle printed at 13:42 the line was drawn, and I dumped the trade. Prices turned around from that point and had I stayed, I'd suffered a far worse loss.
This is the problem with the MACD I've always had. Do I stay or do I go now? So atleast for the past two days friday and monday, it's worked out great. Giving me a point of refrence, a place where I can say, " Ok it looks like this MACD cross is over, because this line just printed" Now again I only saw one place where today the line printed, and prices continued up. So had you gone short, you would of loss. But note that prices did eventually turn.
Ok well I'm going to post these charts just to get any feed back. I'm using the "ZigZag" indicator. I had never really used it because I thought it did not confirm the swings till maybe two or three plots into the current line being drawn. Turns out that it does not plot a line till price is turning. I watched it all day today, and I only saw one instant where the line ploted, and prices continued up, instead of turning around. But prices did turn very shortly their after.
In the first picture you see the green arrow around 13:20. Thats where I went long at, and you can see that the line has printed, confirming a pivot or swing. Now that combined with a MACD, and a 50ma and a 200ma worked very well all day.
All and all I just wanted to go long today, because the 50ma was above the 200ma. However we all know you can get in great shorts on bullish day. So the two short trades you see where just that. Those where places I thought it might sell off at, I used the "ZigZag" indicator to confirm it, and I was right. Yah for me!
In the second picture you can see that I went long again at about 13:42. Now I had already made a point from the first long at 13:20. So as soon as that blue candle printed at 13:42 the line was drawn, and I dumped the trade. Prices turned around from that point and had I stayed, I'd suffered a far worse loss.
This is the problem with the MACD I've always had. Do I stay or do I go now? So atleast for the past two days friday and monday, it's worked out great. Giving me a point of refrence, a place where I can say, " Ok it looks like this MACD cross is over, because this line just printed" Now again I only saw one place where today the line printed, and prices continued up. So had you gone short, you would of loss. But note that prices did eventually turn.
Click image for original size
Click image for original size
Emini Day Trading /
Daily Notes /
Forecast /
Economic Events /
Search /
Terms and Conditions /
Disclaimer /
Books /
Online Books /
Site Map /
Contact /
Privacy Policy /
Links /
About /
Day Trading Forum /
Investment Calculators /
Pivot Point Calculator /
Market Profile Generator /
Fibonacci Calculator /
Mailing List /
Advertise Here /
Articles /
Financial Terms /
Brokers /
Software /
Holidays /
Stock Split Calendar /
Mortgage Calculator /
Donate
Copyright © 2004-2023, MyPivots. All rights reserved.
Copyright © 2004-2023, MyPivots. All rights reserved.