ES Short Term Trading 12-01-2010
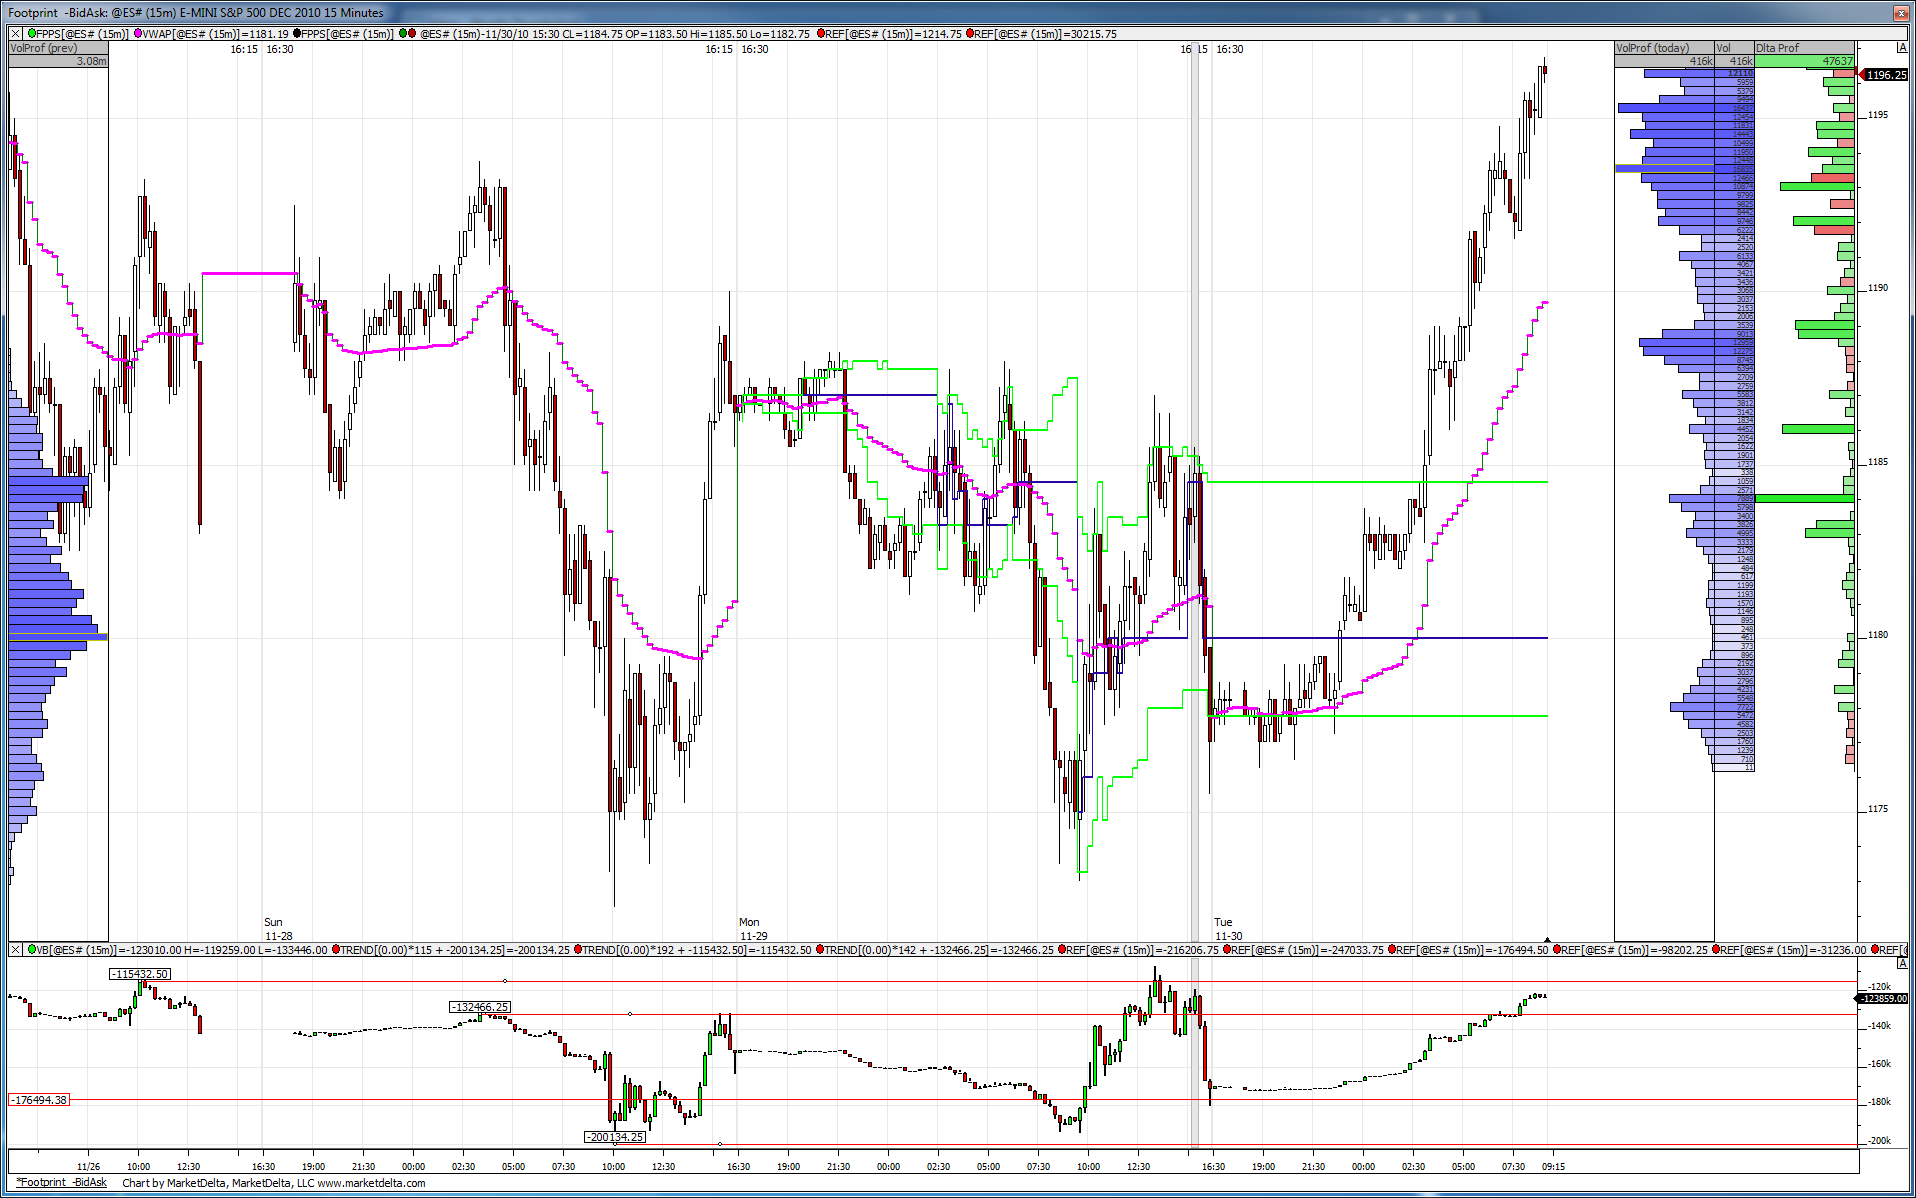
Here is the cumulative delta picture. Yesterday as prices rallied CD (cumulative delta) found resistance at the Friday peak, then as prices sold off CD stopped at that support area where buying has been entering the market over the last two days.
Now we have this large rally in the O/N but CD is still below yesterday's peak.
What this all means is within the last few days price range there has been no real net gain in either short inventory or long inventory.
Lets see if RTH brings in new volume.
Now we have this large rally in the O/N but CD is still below yesterday's peak.
What this all means is within the last few days price range there has been no real net gain in either short inventory or long inventory.
Lets see if RTH brings in new volume.
Click image for original size
changing add point to 09.50 ...see 11-11-10 and 11-12 -10 for reference points...average in is 06.75 on these runners
Once again YM has made new 30 min high while ES and NQ have not. Will have to wait until 1:30 for this to be confirmed.
here is big whole on my Volume Profile.....these usually fill in on the same day ( because of the size)but for me I now have two things....those quads and this whole.....which fill in overtime....so this may run a bit but I know they will come back....
I'm not meaning to imply that I will hold overnight or keep adding to this trade over and over....I'm agressive but not stupid..
If they don't get the whole today then we need to keep itin mind on any future day ( within 3 days for the quads) that starts trading or comes back into todays range
For me I will add into 09.50 and that will be it....and will close out near 11.75 if wrong now...
afterall we have the hour breakout and the non-gap fill and we opened outside of range and never traded on both sides of the open...implies trend.....so all fades today and adds have been lighter in general
I may not have broken my fade mentality but I'm chipping away at getting better by trading smaller on days like this..
Click image for original size
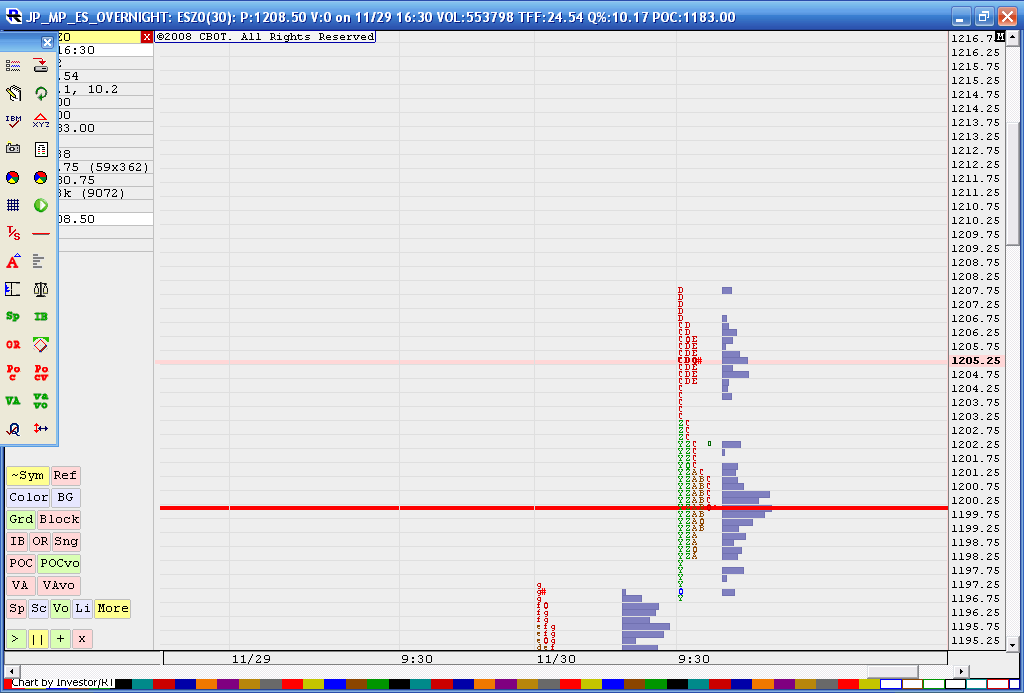
a very important idea that I'm looking at is that the "hole" is not just any ordinary air pocket or single print as per 30 minute analysis....this is an unusal hole in my volume data as IB volume gets clumped and I don't see these as big as todays without filling in....
Here is what I'm showing Bruce.
Click image for original size
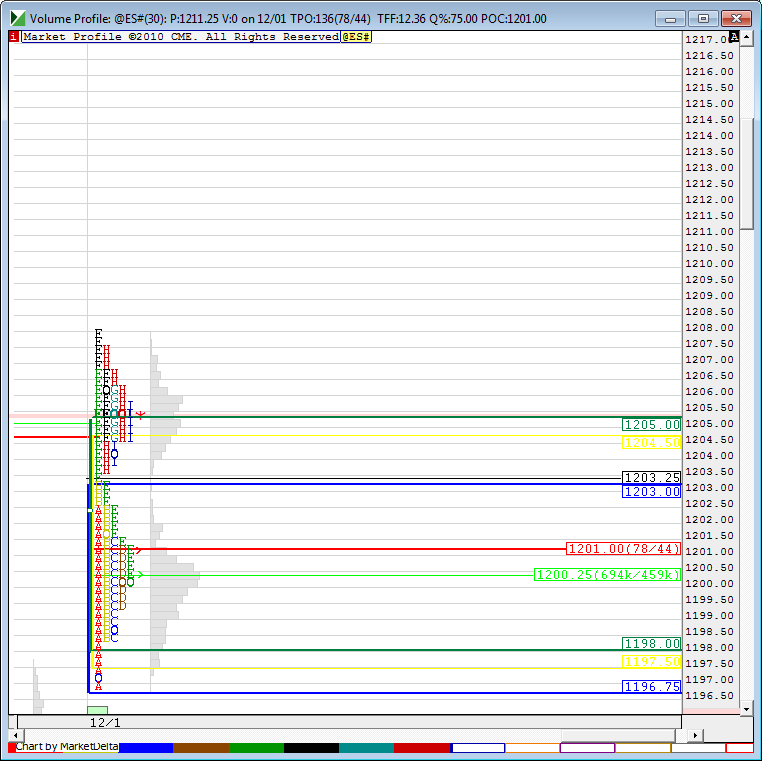
everyone is trying to decide " Is this a valid breakout ?
hard to tell as volume is higher at specific breakout point from "C" formation thread but volume isn't higher above that....after the breakout.....seems to have dried up a bit up there...
so the breakout folks want it to close above 1202- 1203 and us faders want the selloff to have it close back inside the bigger range....and way below 1202 - 1203
thanks Lorn....gaps in data so super low volume...I guess we need to wait for final hour.....those quads still below also....tough call...I'm holding only two now....and those will stop out at 06.75...that is just above that mini spike of volume on one minute time frame...03.50 was main target so after that I have no clue...and no good place for stops!
so if this triple holds it will go for that 1211...I think this one is gonna get run out.....so now that I see that it changes things a bit......
now adding at 05.25 for triples....new highs will be a concern for all contracts (runners have the 06.75 stop pulled)
so now we have three magnets below:
1) quads
2) triples
3) single print complete fill
and when it trends we will lose!
1) quads
2) triples
3) single print complete fill
and when it trends we will lose!
haha! That is a new saying for sure....
"When it trends we will lose!"
"When it trends we will lose!"
Originally posted by BruceM
so now we have three magnets below:
1) quads
2) triples
3) single print complete fill
and when it trends we will lose!
Emini Day Trading /
Daily Notes /
Forecast /
Economic Events /
Search /
Terms and Conditions /
Disclaimer /
Books /
Online Books /
Site Map /
Contact /
Privacy Policy /
Links /
About /
Day Trading Forum /
Investment Calculators /
Pivot Point Calculator /
Market Profile Generator /
Fibonacci Calculator /
Mailing List /
Advertise Here /
Articles /
Financial Terms /
Brokers /
Software /
Holidays /
Stock Split Calendar /
Mortgage Calculator /
Donate
Copyright © 2004-2023, MyPivots. All rights reserved.
Copyright © 2004-2023, MyPivots. All rights reserved.