ES Short Term Trading 12-8-10
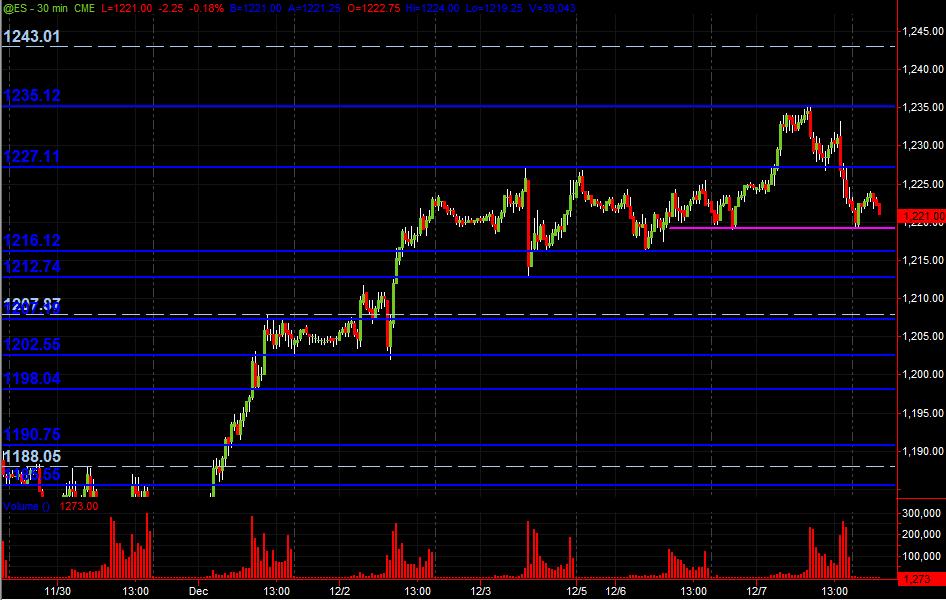
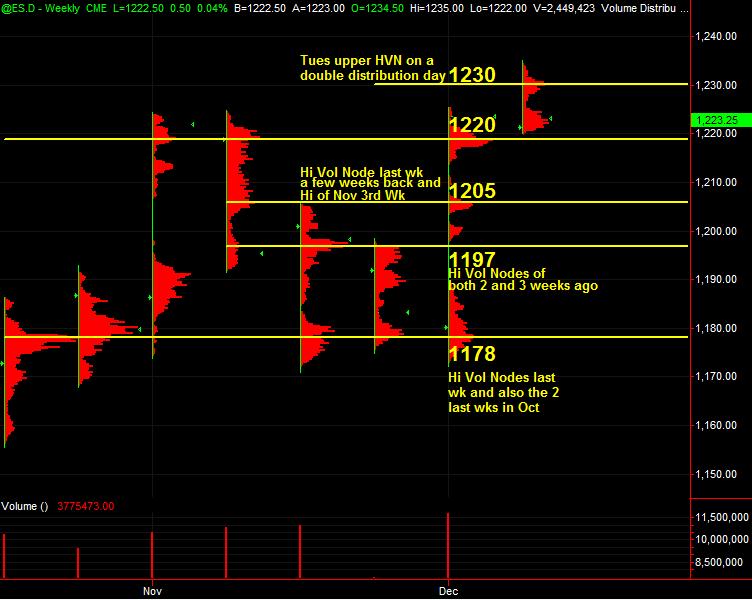
Just to kick off the topic with what I've got on an ES 30-minute chart showing PASR levels in Blue with the light dashed lines being Wkly Pvt levels. Merely a "map" coming into Wednesday's trading. Also, am posting from TradeStation charting, the Weekly Volume at Price HVN price areas from RTH. Not much changes in price levels from last posting of my charts. Hope some folks find this useful!
Click image for original size
Click image for original size
19.75 has a gap in the data...so low volume here on this push up..into 20.75
Click image for original size
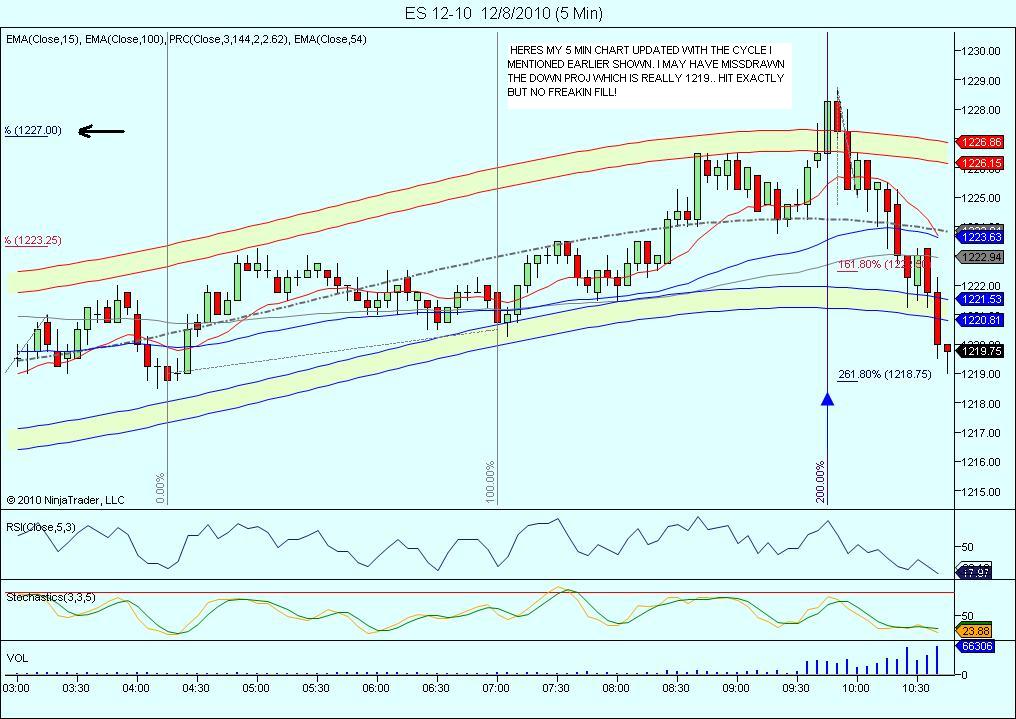
on a small contract short at 21 for 19.75 fill in...many projections go to the 16 - 17 area today
added two more at hit of 22.75....not leting this go too far againt me
don't think my gap in data is a great target for "them" to see..anyway we are in the biggest volume bar of the day now and an obvious key area
bad trade location here ..could just chop..and concern about 23.50 LVN
fwiw... think Monkeys key vol # at 1220 is key, push of 15 min close back above last 10:45, monkey's Monday post
took loss at 22.75 ...trying one more time from 23.75...small again
looking a 21.50 test before 25.50 area
too much time in here....accepting the low volume area from earlier
BINGO...1125.00 .. NICE DAY OFF TODAY.. Good luck trading to all! (actual exit was 1125.25)
Emini Day Trading /
Daily Notes /
Forecast /
Economic Events /
Search /
Terms and Conditions /
Disclaimer /
Books /
Online Books /
Site Map /
Contact /
Privacy Policy /
Links /
About /
Day Trading Forum /
Investment Calculators /
Pivot Point Calculator /
Market Profile Generator /
Fibonacci Calculator /
Mailing List /
Advertise Here /
Articles /
Financial Terms /
Brokers /
Software /
Holidays /
Stock Split Calendar /
Mortgage Calculator /
Donate
Copyright © 2004-2023, MyPivots. All rights reserved.
Copyright © 2004-2023, MyPivots. All rights reserved.