Cumulative Delta
To help illustrate the usefulness of Cum Delta, I'll post some charts. The first ones will have BruceM zones as reference. Hopefully this will stimulate some discussion and sharing of Cum Delta ideas.
I'd like to know how you are using the correlation of CD to total volume. Do you have two or three main patterns that you see that are useful ? Seems like I'm the only one asking questions.
How about using a volume ratio ? Specifically
(ask voluume / ask volume + bid volume)) *100 so if the reading is greater that 50% then up volume is dominating. less that 50% then down volume is dominant
Greater than 80% would be strong buying and less than 20 is strong selling...just throwing that out there...
Originally posted by beyondMP
Originally posted by BruceM
I'm not sure if this is appropriate here but are you planning to discuss the different "events" that you like to use? Are they all derived from the CD data? Very interesting and refreshing to hear that price is not an important visual. Is it safe to say that you don't even need it on your main chart screen ?
There are 2 other separate "events" I use in my trading of the "ES", unrelated to CD, but important to me. As this is meant to be a discussion of CD and its usefulness, I don't think they would be of value here.
There is another metric to CD, I find useful. It is an evaluation of CD against total volume. It helps me to see the "true" direction of CD. It actually comes from a seperate chart but for purposes of illustration I've added to the "renko' chart.
I need price on the main chart to see the price for my entry, but it is not needed for any of CD calculations. Price based indicators are of no value, in my concept of how the markets operate.
Click image for original size
I have real problems seeing the contrast in those price charts posted. is it possible to lighten the background a little?
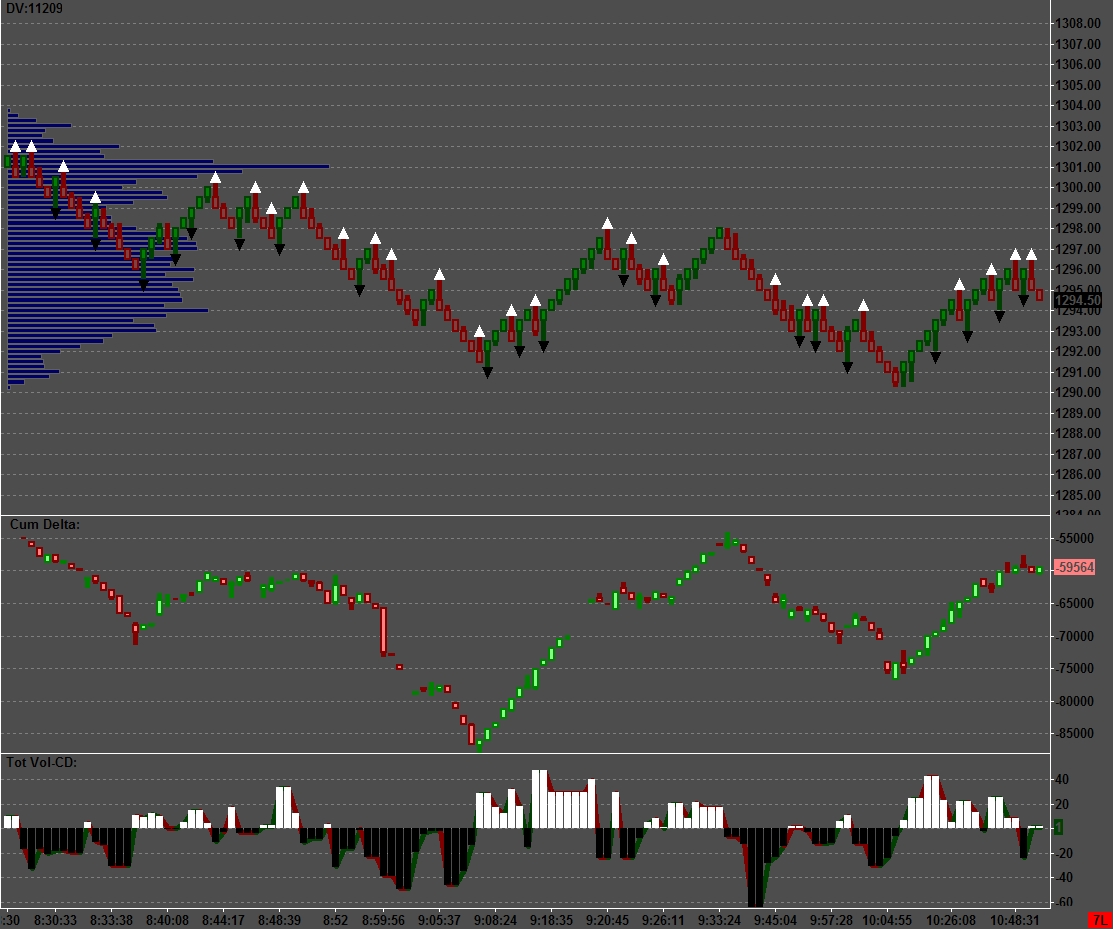
I copied the chart and stuck it into a word doc so I could get a different contrast, and right now I am seeing one of the great dichotomies I noticed a few years ago when I looked at cumulative delta and wondered how it should be used.
When I look at the chart posted, I can see a well defined DT in the renko chart (to the right side of center on the cahrt).
I look below and I see CD in a strong uptrend. years ago when I would see a pattern of price and CD like that, my thought was: great, more on the upside until I see a lower peak in CD... kinda wrong, huh?
NOW, thank you, BeyondMP, for your addition of the "total vol CD" at the bottom. Now (at least for the time being, I can offer a working hypothesis:
Thesis (right or wrong, tell me): total vol CD (as displayed in the bottom sub-plot) must either offer confirmation (bigger volume) or non-confirmation (total vol CD waning from recent high of "tot vol CD") when compared to the straight CD displayed in the middle chart?
Here's what I'm referring to:
1st, I'll refer to the "tot vol CD" peak above the 8:48:xx time stamp. Here the tot vol CD moved higher, but price did not and the straight CD did not. my intyerpretation, bigger volume is only the result of churn as those long are handing off to new buyers, but the new buyers are just holding the bag because price is not advancing.
then by 8:52 timestamp, both price and CD are breaking down out of sideways. and tot vol CD declines (tot vol delcines because there is a "buyers' strike" -fear has inspired appreciation of the safety of the "I don't want to make a decision" sidelines, while those who were buyers only minutes before could be abandoning their longs, causing price to move lower to hit lower bids because the ranks of the buyers have thinned tremendously (on the sidelines).
So, it looks like that from 8:52 to 9:05, buyers remained on the sidelines as sellers were forced to hit lower and lower bids to free themselves of their losing long positions.
Lower prices begat more selling and then some sort of a minor panick of sellers near 8:55 (notice big drop in CD while tot vol cd and price just methodically move lower.
eventually, tot vol CD makes a good sized lift (8:55) some bargain hunters play the long side as can be seen in a "stronger than before" move up in the tot vol CD and a sideways stutter in the CD. but price continues to slip
SOmething changed at 9:05.
That sustained increase in the tot vol CD just above 9:05 timestamp could actually be viewed as an area of capitulation (selling capitulation that freed the market of weak-handed longs (they sold out) and ushered in buyers who overwhelmed the selling prissure (as evidenced by the reversal in the middle chart), which seems to have been confirmed by the increase in the tot vol CD
looking at the "tot vol CD" (bottom subplot) above the 9:08 timestamp at the same time, I am looking at the CD in the middle chart.
Straight CD in middle subplot reverses, and both volume and price increase. you can see what price did.
(I don't know, I'm trying to put a psychological face to the activity.)
NOW, I am gooing to look at the apprent DT (tops near 9:20 and 9:33 on the timeline), and I look at the tot vol CD above that 9:33 timestamp and I see that the interest (as measured by tot vol CD) is waning, not confirming the positive action in the CD and suggesting that total interest (the number of buyers interested in those prices) is waning (not really confirming additional interest on the part of the buyers. (as evidenced by the tot vol CD).
BeyondMP,
is this right,
is it wrong,
is it close,
is it not even close,
should I just drink the hemlock?
Thanks for posting the chart.
Originally posted by BruceM
I'd like to know how you are using the correlation of CD to total volume. Do you have two or three main patterns that you see that are useful ? Seems like I'm the only one asking questions.
How about using a volume ratio ? Specifically
(ask voluume / ask volume + bid volume)) *100 so if the reading is greater that 50% then up volume is dominating. less that 50% then down volume is dominant
Greater than 80% would be strong buying and less than 20 is strong selling...just throwing that out there...
I can see where this could be helpful. I caution against using static points for comparison-80/20. In my mind they would only be useful if you knew you were comparing a fixed "pool" of buyers and sellers. Once the "pool" changes it can only become a relational comparison. Is there more or less? As opposed to a specific threshold.
The first part of your question overlaps Paul9's question and I'll try and answer it there.
I agree...static points might not be the best. Perhaps if we make a high for example and the ratio hits 80% then it may be useful to know where the ratio is the next time we trade to that high.....Is it approaching that high with only 50% buyers....? Just some ideas..
Constantly asking "Is the market going higher/lower" with less or more involvement
Constantly asking "Is the market going higher/lower" with less or more involvement
Originally posted by BruceM
I agree...static points might not be the best. Perhaps if we make a high for example and the ratio hits 80% then it may be useful to know where the ratio is the next time we trade to that high.....Is it approaching that high with only 50% buyers....? Just some ideas..
Constantly asking "Is the market going higher/lower" with less or more involvement
I think you are actually restating the "divergence" question. I still think that trying to compare one level to another, whether it be static or not is only valid when comparing the same participants. With differing groups of participants, I think you can only see the moment's relational difference. One group's "more" might be equal to another groups "more" but the only thing you know for certain is at the moment there is "more".
Thesis (right or wrong, tell me): total vol CD (as displayed in the bottom sub-plot) must either offer confirmation (bigger volume) or non-confirmation (total vol CD waning from recent high of "tot vol CD") when compared to the straight CD displayed in the middle chart?
You are not wrong, if this theory makes sense to you.
I see it more as a momentum metric to CD. As I have mentioned before I compare CD to a specific price increment. In realtime I can watch CD movement. Total vol-CD can only be evaluated after the fact, it then becomes a coincidence to CD as opposed to an "event". First something happens(CD) then I can measure some aspect of it(Total Vol-CD).
Total vol-CD, to my mind, shows me the "power" behind CD. For lack of a better term its momentum.
I am, truly, impressed with the detail and time invested in your analysis.
pardon my ignorance, but what is total vol - cd ? are they just volume bars, where those bars are just range bars instead of fixed time bars ? trying to understand how that bottom subplot in beyond's chart is actually created...thanks
Originally posted by lsw
pardon my ignorance, but what is total vol - cd ? are they just volume bars, where those bars are just range bars instead of fixed time bars ? trying to understand how that bottom subplot in beyond's chart is actually created...thanks
There is another metric to CD, I find useful. It is an evaluation of CD against total volume. It helps me to see the "true" direction of CD. It actually comes from a seperate chart but for purposes of illustration I've added to the "renko' chart.
You might be able to come close to it if your charting package offers some sort of indicator for Cum Delta on total volume.
thank you beyondmp, i have ninja trader and sierra charts but could not find any Cum delta on total volume type of study/indicator...do you know of any in these charting packages ?
Originally posted by lsw
thank you beyondmp, i have ninja trader and sierra charts but could not find any Cum delta on total volume type of study/indicator...do you know of any in these charting packages ?
If you send me a PM with an email address I'll forward my SC chartbook and associated files to you. I don't think MyPivots supports transfer of the specific file types.
sorry abt the confusion, had to create a temporary username since i had forgotten the pwd on this account ! years don't come lightly...all sorted out now
Emini Day Trading /
Daily Notes /
Forecast /
Economic Events /
Search /
Terms and Conditions /
Disclaimer /
Books /
Online Books /
Site Map /
Contact /
Privacy Policy /
Links /
About /
Day Trading Forum /
Investment Calculators /
Pivot Point Calculator /
Market Profile Generator /
Fibonacci Calculator /
Mailing List /
Advertise Here /
Articles /
Financial Terms /
Brokers /
Software /
Holidays /
Stock Split Calendar /
Mortgage Calculator /
Donate
Copyright © 2004-2023, MyPivots. All rights reserved.
Copyright © 2004-2023, MyPivots. All rights reserved.