ES Short Term Trading for 4-20-2011
here's a look at a profile chart this morning. We have a huge opening gap up this morning and it has left some single prints down at the 22.50 to 21.25 range. I am thinking to go short just after the open around the O/N highs of 28.50 to 1320.75 which is the bottom of the value range today.
Click image for original size
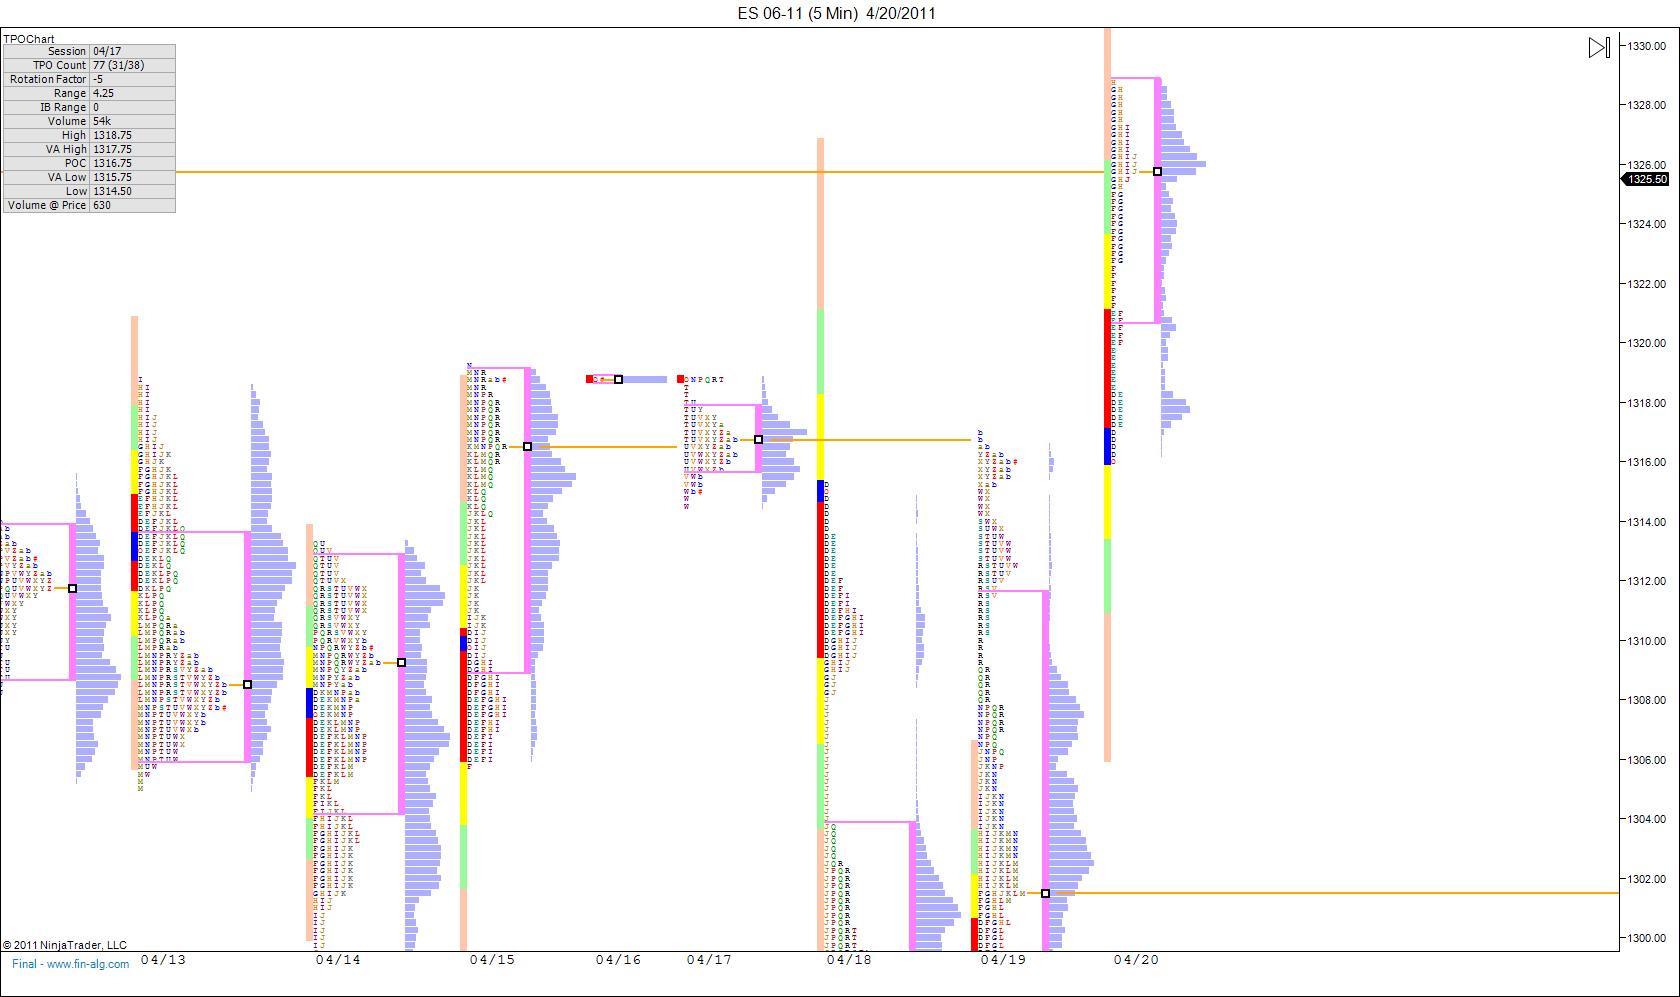
Looks to be about 1321 at the open.
added at 29 even......lets see if air can fill below
i am with you bruce...short from 29 and aiming for 27
This just seems like an out of control buying binge. i'm trying a short here at 28. ahhhh while writing this i see why.. home sales report came out with a good report. How stupid. i'm short at 29 i can't believe they even pushed it that high. after this i think i will go over to the MUD pit were they have some sense.
just to clarify, i added at 29 sorry for the confusion. looking for 26 or a retest of 25
27 is the air fill level fo curse (as per bruce's comment)
Originally posted by apk781
i am with you bruce...short from 29 and aiming for 27
air filled on the 27 print...no air left
Originally posted by optimusprime
This just seems like an out of control buying binge. i'm trying a short here at 28. ahhhh while writing this i see why.. home sales report came out with a good report. How stupid. i'm short at 29 i can't believe they even pushed it that high. after this i think i will go over to the MUD pit were they have some sense.
Sales of existing-home sales rose in March, continuing an uneven recovery that began after sales bottomed last July, according to the National Association of Realtors.
Existing-home sales1, which are completed transactions that include single-family, townhomes, condominiums and co-ops, increased 3.7 percent to a seasonally adjusted annual rate of 5.10 million in March from an upwardly revised 4.92 million in February, but are 6.3 percent below the 5.44 million pace in March 2010. Sales were at elevated levels from March through June of 2010 in response to the home buyer tax credit.
Source: http://www.realtor.org/press_room/news_releases/2011/04/rise_march
flat at 27.... have a great day everyone.
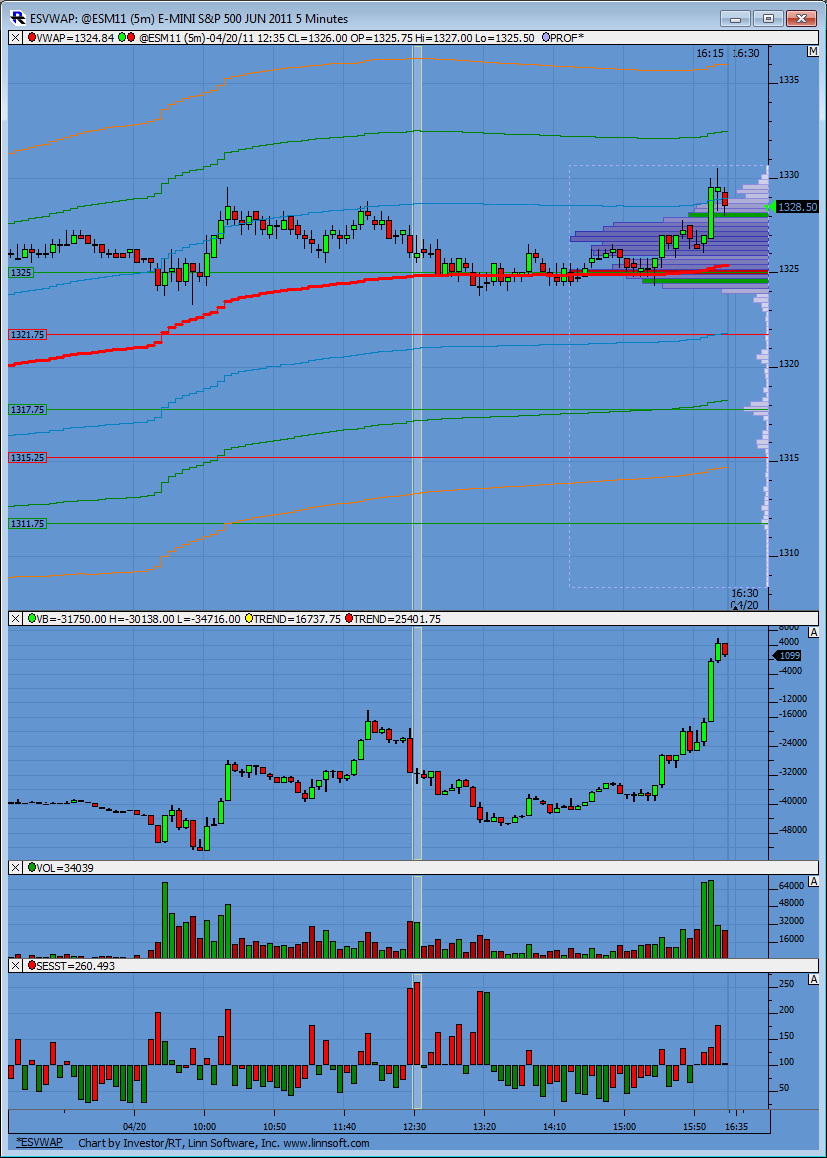
Here is the end of day chart to study. I've added a new pane at the bottom of relative volume. The bars compare volume to that specific time frame over 200 days of trading to give a relative percent reading compared to the normal (average) volume of that period. So for instance, the two big red bars at 12:25 and 12:30 were saying the volume at those time stamps was 250% greater in relative strength then the average over the last 200 days.
Not sure if it helps any. I'm just experimenting with it.
Not sure if it helps any. I'm just experimenting with it.
Click image for original size
Emini Day Trading /
Daily Notes /
Forecast /
Economic Events /
Search /
Terms and Conditions /
Disclaimer /
Books /
Online Books /
Site Map /
Contact /
Privacy Policy /
Links /
About /
Day Trading Forum /
Investment Calculators /
Pivot Point Calculator /
Market Profile Generator /
Fibonacci Calculator /
Mailing List /
Advertise Here /
Articles /
Financial Terms /
Brokers /
Software /
Holidays /
Stock Split Calendar /
Mortgage Calculator /
Donate
Copyright © 2004-2023, MyPivots. All rights reserved.
Copyright © 2004-2023, MyPivots. All rights reserved.