MP Bonds -
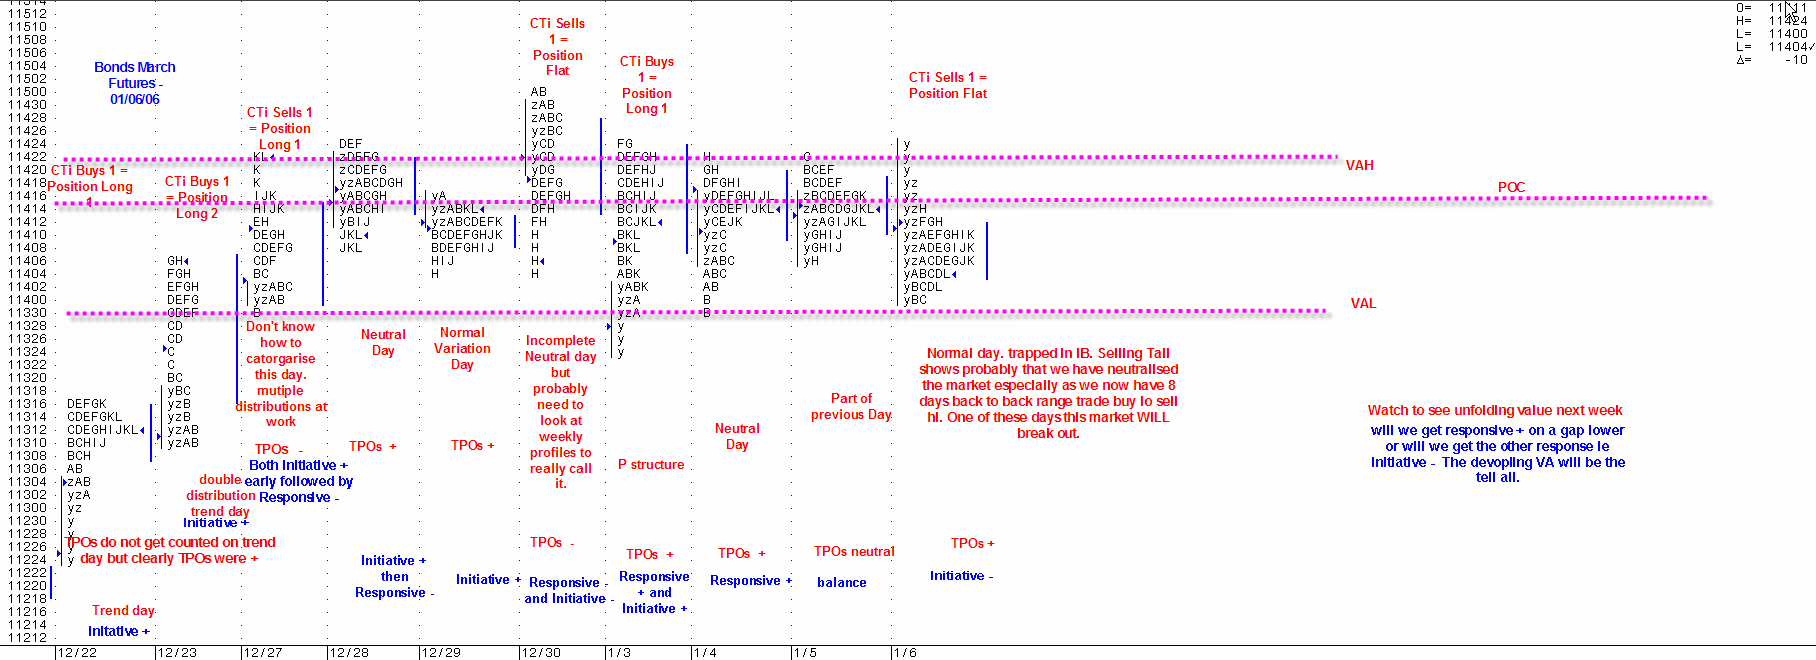
That's an amazingly good summary chart of the last 10 days of trading in the bonds - thanks Alex!
I have a question. The VAH, VAL and POC that you show on the chart, are they calculated from the most recent trading session? i.e. Friday. The reason that I ask this is that the VAH and VAL appear to be outside the 68% bell curve for Friday... I am only eyeballing this and haven't calculated it.
I have a question. The VAH, VAL and POC that you show on the chart, are they calculated from the most recent trading session? i.e. Friday. The reason that I ask this is that the VAH and VAL appear to be outside the 68% bell curve for Friday... I am only eyeballing this and haven't calculated it.
i think that the high and low va are calculated from all 10 days. if you have a look at the profile across all 10 days then you can see that the va would be around where alex has marked it.
After looking at the chart for a bit longer I think that I have answered my own question. The VAH and VAL mark the whole chart right?
obone - I must have been posting my comment when you posted yours. Yes, I agree with you.
Emini Day Trading /
Daily Notes /
Forecast /
Economic Events /
Search /
Terms and Conditions /
Disclaimer /
Books /
Online Books /
Site Map /
Contact /
Privacy Policy /
Links /
About /
Day Trading Forum /
Investment Calculators /
Pivot Point Calculator /
Market Profile Generator /
Fibonacci Calculator /
Mailing List /
Advertise Here /
Articles /
Financial Terms /
Brokers /
Software /
Holidays /
Stock Split Calendar /
Mortgage Calculator /
Donate
Copyright © 2004-2023, MyPivots. All rights reserved.
Copyright © 2004-2023, MyPivots. All rights reserved.
