ES 5-19-11
Prefer shorts on a higher open today or after 8:30 A.M reports.....Yesterday was another low Volume rally....
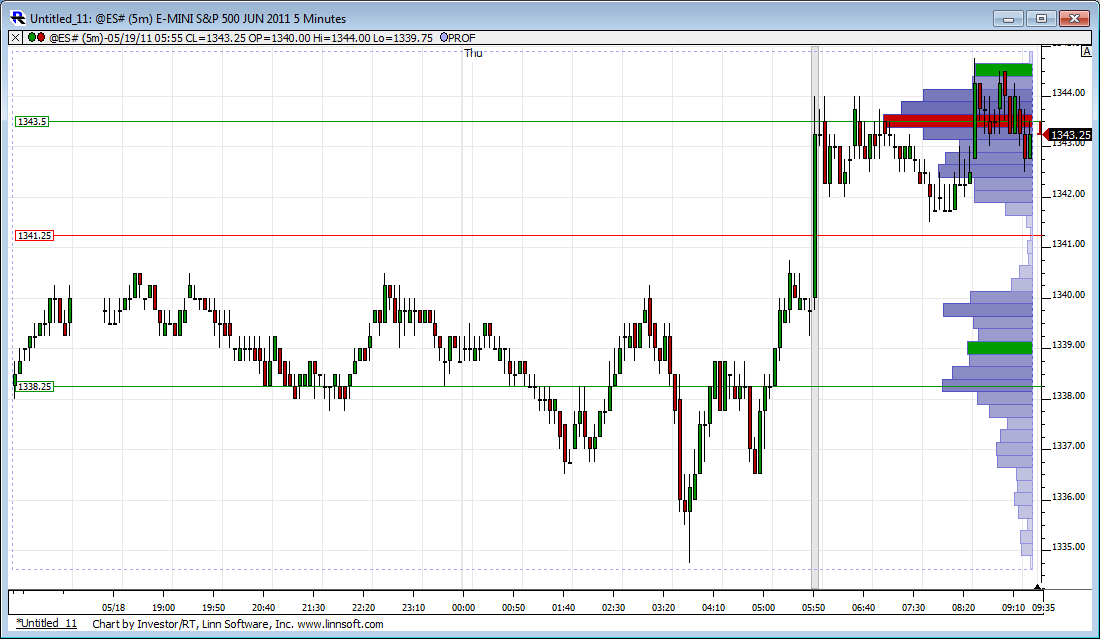
keys on upside will be 45 - 48 and 52.50 - 55...ideal sell zones
other key area is 1340..lots of time spent there....but the biggest key will be 1332.75 - 1334.75 as support ...this is where the buyers defended yesterday and we have the peak volume price that never got revisited.....
Options expiration so I am working under the assumption that they will want to keep it away from 1350 as long as possible..
Many reports at 10 this morning which makes life a bit harder ....
Originally posted by neoikon
This is a statistics tool available with the software I use.
Originally posted by Lorn
Its a "relative strength" based volume statistic. Comparing current volume to an X number of historical periods and then comparing it on a relative strength basis where 100 is equality.
Hmm, getting a lot of RSI hits when doing a search (as expected). I was just looking for something similar for eSignal.
Just looking at volume by itself sometimes isn't that interesting, so I really like how that displays it. Easy to see that relative strength, as you mention.
Originally posted by Lorn
This is a statistics tool available with the software I use.
Sorry to keep bothering you about this... one last question.
Does it only compare the last volume bar with the current (thus, it is only relative to the very last bar), or the current bar with an MA/average for the day/period?
I'm comparing each bar to the last 200 days of that respective bar. So the 30-min bar ending at 10:00am will compare that volume to the last 200 days worth of 30-min bars ending at 10:00am.
Make sense?
Make sense?
Originally posted by neoikon
Originally posted by Lorn
This is a statistics tool available with the software I use.
Sorry to keep bothering you about this... one last question.
Does it only compare the last volume bar with the current (thus, it is only relative to the very last bar), or the current bar with an MA/average for the day/period?
Originally posted by Lorn
I'm comparing each bar to the last 200 days of that respective bar. So the 30-min bar ending at 10:00am will compare that volume to the last 200 days worth of 30-min bars ending at 10:00am.
Ahh, okay, thanks!
As an aside, if anyone out there is using eSignal, I made an indicator to help identify "Running the Triples" situations. It's free.
http://neotoolbox.com/blog/post/2011/05/18/EFS-Running-the-Triples.aspx
http://neotoolbox.com/blog/post/2011/05/18/EFS-Running-the-Triples.aspx
Just for info , I have stretch 161 at 1346.50 , if it gets up there that would make a nice little 3 up today
taking all off at 40.75......just don't trust that area and no ammo to hold longer
All news missed. (obviously) ;]
Correct- Lorn has trips down pat...so still a valid target to consider
Emini Day Trading /
Daily Notes /
Forecast /
Economic Events /
Search /
Terms and Conditions /
Disclaimer /
Books /
Online Books /
Site Map /
Contact /
Privacy Policy /
Links /
About /
Day Trading Forum /
Investment Calculators /
Pivot Point Calculator /
Market Profile Generator /
Fibonacci Calculator /
Mailing List /
Advertise Here /
Articles /
Financial Terms /
Brokers /
Software /
Holidays /
Stock Split Calendar /
Mortgage Calculator /
Donate
Copyright © 2004-2023, MyPivots. All rights reserved.
Copyright © 2004-2023, MyPivots. All rights reserved.