ES 5-20-2011
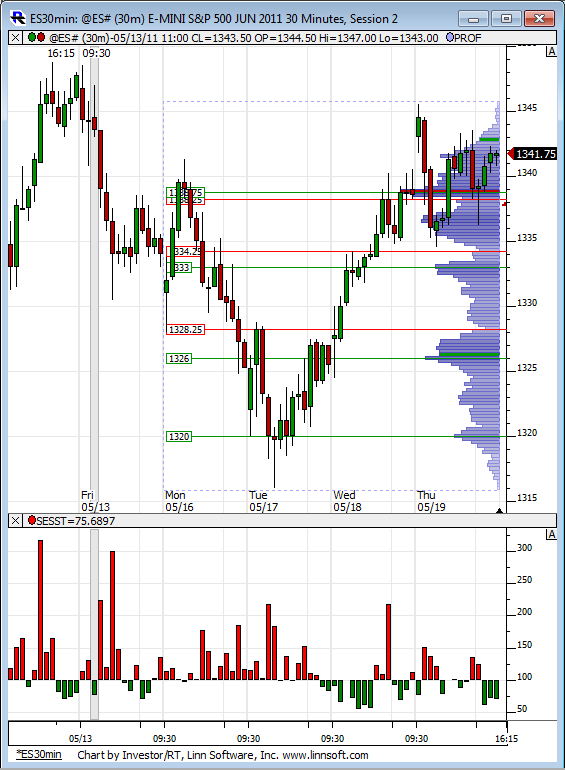
Here is the weekly RTH volume profile through Thursday. POC ins the thick red line at 1339. Compared with the relative volume on the lower pane saying this is a low volume environment, prices are simply digesting the big move up from Tuesday. More sideways action today or do prices break above/below this congestion?
Click image for original size
EMA and XMA just different shorthand for the same thang - Exponential Moving Average.
Originally posted by neoikon
Originally posted by neoikon
Stupid question... what's an "xma"? An X-tra special Moving Average? Another term for EMA?
I see that in the above post you do mention "exponential" at one point, so I gather that is what you meant. I've just never heard it labeled "xma".
52.8% of PP to R1 is 1344... O/N High
78.6% of PP to S1 is 1337.75... 1T from O/N Low
Gap fill at 41.75.
No news events today.
78.6% of PP to S1 is 1337.75... 1T from O/N Low
Gap fill at 41.75.
No news events today.
Originally posted by BruceM
This is from PAUL...I don't know how to move a post over but credit goes to Paul for this post below:
I just wanted to quickly mention that there is a Breaker Bar in place in the overnight. I am looking at 30min chart 24hr prices.
A breaker bar is a wide range bar (relative to other PA) that breaks out of a zone of sideways consolidation.
The Open of such a bar is often tested. the open for the 30min bar I am referring to is 1340.25 (remember 1340.50 was RTH H 2 days ago).
If price can swing back up to test that open, PA is very important at/near that level, I consider it an inflection price point where price is either going to break up through it or be rejected. I have no idea what the volume profiles look like, maybe Bruce can update.
Thanks for this post BruceM and Paul9. To add, I also trade what you call the Breaker Bar. But my focus is not the bar's open, which depends on a time slice. I concentrate on a level at or above (in this case) breaking of the previous bar. That break-out point is going to be tested most of the time - you can check your 30 min charts. If it does not get tested soon, the price almost always come back to it later. If you watch "delta" or see a volume spike on a small time frame, you can see where the big break-out order came. fwiw
Of course one can also drop to the smallest time/volume frame and see where the break occured
Thanks, LisaP,
Just to clarify, If I am looking at the 30min bar, the breaker bar that completed at 07:00 this morning, Are you saying that you would look to the close of the bar preceding it as a target?
Just to clarify, If I am looking at the 30min bar, the breaker bar that completed at 07:00 this morning, Are you saying that you would look to the close of the bar preceding it as a target?
thanks for url, MM.
very interesting
very interesting
I'm not sure if overnight triples count as much as those during RTH, but here are the 4 I have on my chart:

Originally posted by neoikon
I'm not sure if overnight triples count as much as those during RTH, but here are the 4 I have on my chart:
Just took out the bottom two (blue). Also, S1 is right here at 35.75.
It's all good...I just wanted to make sure that nobody trades for O/N triples or anything mentioned on these threads without doing their own research first.....
Most know not to do this I hope...
u have a great weekend too..
Most know not to do this I hope...
u have a great weekend too..
Originally posted by TradeQueen
Absolutely. Thank you. And I sincerely hope my comments are NOT taken as sarcasm. I was simply amazed by the market movement today and thought I could add a touch of humor to what I considered a WOW moment.
Actually hoped it did fill for that virtual group high five moment!
If I don't say anything else, I'd like to take this moment to wish everyone a great weekend! g'night!
Originally posted by BruceM
I have no evidence of the reliability of Triples in the Overnight session being run out so use them as targets at your own risk.....Originally posted by TradeQueen
I'm going to go put on a diaper, because if the two left up there in the 40's fill today.... I'm going to need it!
Originally posted by BruceM
nice run of those triples from yesterday....without me...
Emini Day Trading /
Daily Notes /
Forecast /
Economic Events /
Search /
Terms and Conditions /
Disclaimer /
Books /
Online Books /
Site Map /
Contact /
Privacy Policy /
Links /
About /
Day Trading Forum /
Investment Calculators /
Pivot Point Calculator /
Market Profile Generator /
Fibonacci Calculator /
Mailing List /
Advertise Here /
Articles /
Financial Terms /
Brokers /
Software /
Holidays /
Stock Split Calendar /
Mortgage Calculator /
Donate
Copyright © 2004-2023, MyPivots. All rights reserved.
Copyright © 2004-2023, MyPivots. All rights reserved.