ES Monday 23/Jan/2012
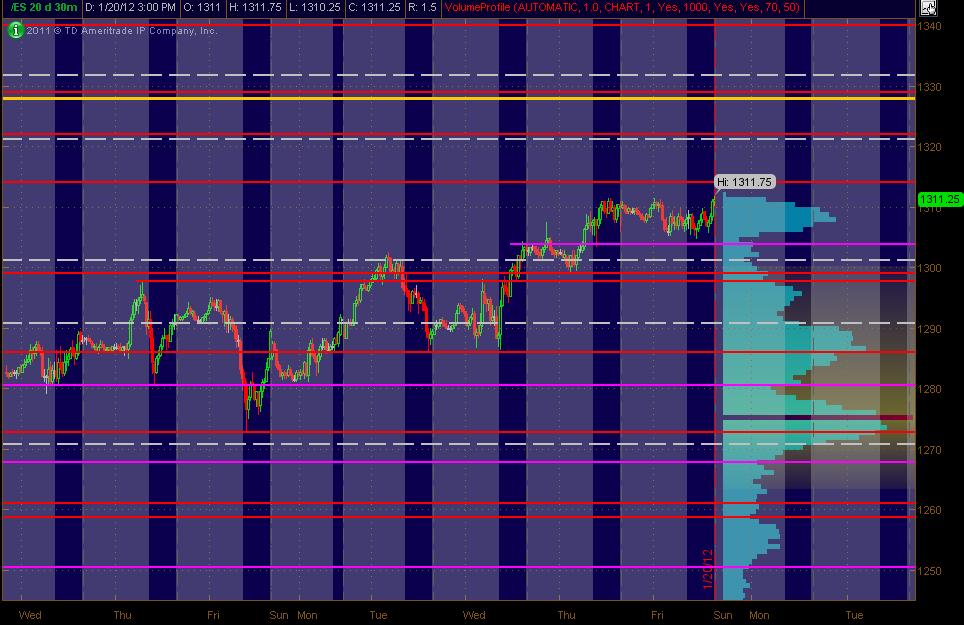
Here's what I've got for my ES MAP of PASR ZONES using a 30min chart of 20 days of data coming into Monday's trading. The Red lines are potential significant levels with Magenta lines as semi-significant. Also, I've drawn in a Yellow line that's a Fib cluster. The White dashed lines are the Weekly Pivots (kind of a background thing to have on the chart). The Light Blue Volume Profile of the past "rolling" 20 days is displayed on the right vertical axis. Btw, price lines that are CLOSE together (within a couple of points), should be taken as an overall ZONE. The Gray background shows non-RTH price activity. Hope, as always, that this is helpful to some as a "MAP."
MM
Click image for original size
MM
gotta lighten some here at 15.50 test due to vwap and a minor low volume area...
I'm also quicker to take a profit when my overnight trade is a loser.....that happened today...I was eexpecting quick SELLING off the open print...so after the first 5 minute bar didn't do that I had to take that off at a loss...
The point is that starting the day session trades with a loser from the overnight messes with my mind a bit....otherwise today was an easy day
still expecting this early strength to be sold today
The point is that starting the day session trades with a loser from the overnight messes with my mind a bit....otherwise today was an easy day
still expecting this early strength to be sold today
trying to get final exit at 14 even..ahead of air pocket fill..vwap here and r2 is at 1216 today.....gonna be a hard hold I think..50% back will be near my final exit
that was 8 higher highs and definately at the far, far extreme of intraday trends...normally it is 3 - 5 bars.....with the plus 8 - 10 zone above I had no problem holding that on the short side up there...although at times it can seem a bit scary
these trends need to take breathers so us faders want to try and position ahead of that rest period....takes practice and belief in ones ideas
these trends need to take breathers so us faders want to try and position ahead of that rest period....takes practice and belief in ones ideas
that's it for me..final is off at 1212.50..nothing left..they were almost right on schedule today on the 1314 test...it's 11 a.m........they hit almost a full days range in the first 30 minutes today..nobody wants to buy when we achieve so much range so fast
lucky sellers with more ammo will be tring to hold for 08 area as long as vwap up at 1315 and r2 can hold it back at 1316
lucky sellers with more ammo will be tring to hold for 08 area as long as vwap up at 1315 and r2 can hold it back at 1316
Nice work Bruce. Appreciate the notes and ideas. thank you.
thanks for all the posts bruce
i was with you bruce on the initial fade of the 4-5.5 area and the highs...volume kept drying up on the 5m chart as we continued to move up so conviction was not too strong on that initial pseudo trend
i was with you bruce on the initial fade of the 4-5.5 area and the highs...volume kept drying up on the 5m chart as we continued to move up so conviction was not too strong on that initial pseudo trend
Originally posted by BruceM
that was 8 higher highs and definately at the far, far extreme of intraday trends...normally it is 3 - 5 bars.....with the plus 8 - 10 zone above I had no problem holding that on the short side up there...although at times it can seem a bit scary
these trends need to take breathers so us faders want to try and position ahead of that rest period....takes practice and belief in ones ideas
10.25 is the bottom of the buying tail that drove us higher from the open and coincides witht eh 10.5 peak volume from last week that bruce mentioned earlier...it will be interesting to see if they attempt a break of the lower edge of the ib...we should see some good fight there i would think
wow, they breezed thorugh those levels...i guess the early longs gave up on their trade long before we got to the bottom of the buying tail
we are now accepting value inside last week's value area and also in weekly terms today's move can be seen as a failed breakout of last week's highs, so taht is sthg to pay attention to
we are now accepting value inside last week's value area and also in weekly terms today's move can be seen as a failed breakout of last week's highs, so taht is sthg to pay attention to
Originally posted by NickP
10.25 is the bottom of the buying tail that drove us higher from the open and coincides witht eh 10.5 peak volume from last week that bruce mentioned earlier...it will be interesting to see if they attempt a break of the lower edge of the ib...we should see some good fight there i would think
Emini Day Trading /
Daily Notes /
Forecast /
Economic Events /
Search /
Terms and Conditions /
Disclaimer /
Books /
Online Books /
Site Map /
Contact /
Privacy Policy /
Links /
About /
Day Trading Forum /
Investment Calculators /
Pivot Point Calculator /
Market Profile Generator /
Fibonacci Calculator /
Mailing List /
Advertise Here /
Articles /
Financial Terms /
Brokers /
Software /
Holidays /
Stock Split Calendar /
Mortgage Calculator /
Donate
Copyright © 2004-2023, MyPivots. All rights reserved.
Copyright © 2004-2023, MyPivots. All rights reserved.