ES 5-17-13
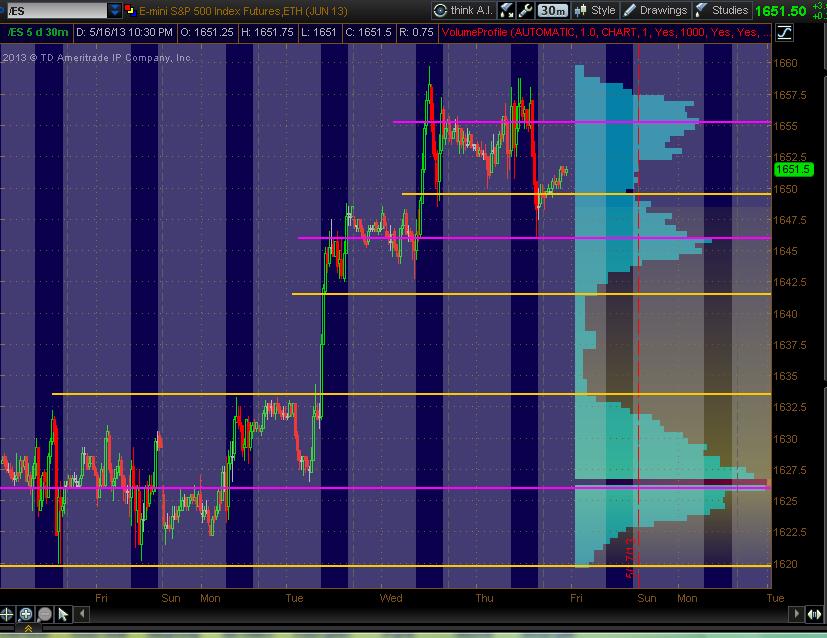
Posting my 5min chart from Thinkorswim showing 5 days with Volume Profile. The point is to initiate a conversation of what different software packages show as HVNs and LVNs. I've drawn lines at price levels for both HVNs and LVNs. Since Bruce is educating so many of us, I thought it would be useful to compare what I and the rest of us have with Bruce's software and price levels for Volume Profile analysis. This is an open door for folks to post their screen shot of the same. Here's what I have with All Trading Hours for 5 days on a 5min chart:
Magenta is where I see HVNs and Yellow is where I see LVNs
Bruce and anyone else share what you've got with a screen shot. This is how we learn folks!
Magenta is where I see HVNs and Yellow is where I see LVNs
Click image for original size
Bruce and anyone else share what you've got with a screen shot. This is how we learn folks!
Also wanted to hit a few bullet points that Bruce has pointed out:
- HVNs will tend to be a "magnet" for price to be attracted to
- LVNs will be a price area or zone for initiating a trade to FADE back towards a HVN
- This is the most basic interpretation ... and leaves out the concept of Value, the statistical marking of where price traded to include 2 standard deviations (vertically displayed) denoting the upper and lower levels of Value
- Also, have to consider a price "push" beyond a level such as the overnight high or low ... "pushing" past that price by a point or two
- Almost always a FADING approach to entry ... just finding the areas
- And fold in TRIPLES, AIR on the 5min chart and not to forget the Pitbull numbers off the open ... the open plus a move 2.5, 4-5.5 and 8-10 as an additional "reading" for confluence to FADE moves in the ES back and fill market movement which is pretty much 80% of the time
- And don't forget the IB (Initial Balance) ... the high and low of the first 30mins of trading ... or the first Hour of trading, being key levels
I'm trying to blend everything together here for all of us ... and also to include the mypivots levels ... to learn and hone in on what works. Bruce has done an incredible job of teaching what he does and what works for trading the ES. Still, there's always discretion in anyone's trading. To have these tools and the map/context of Volume Profile HVNs LVNs and how price should play out offers so much value to traders that want to make it work ... that includes me in the ES arena, as I'm primarily a stock day trader. But this helps all.
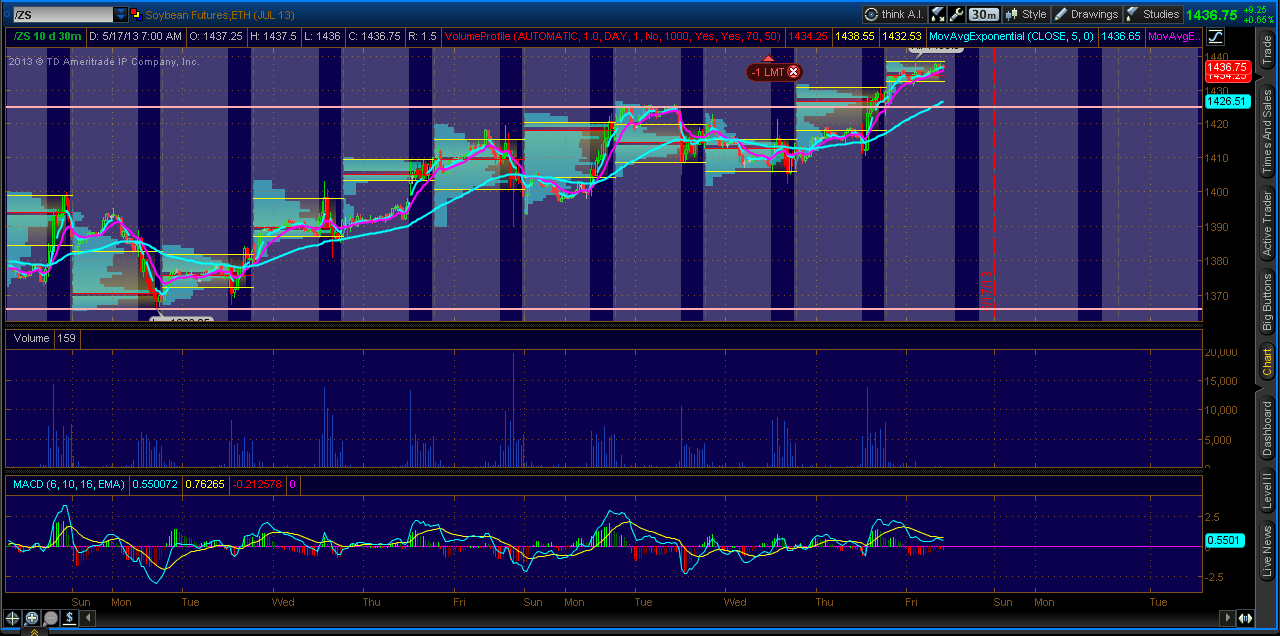
Yeah im using the same type of methodology. Taking fades only when we open inside value, monitoring for breakouts/previous day VA retracement if we re-enter from above or below, but also one thing that has helped me a ton is looking for strong brackets or rectangle patterns where price is bouncing from high to low. I find my fades work MUCH better when the market is in such conditions, and seems to be a good indicator for legitimate breakouts (even though i absolutely hate breakouts). Here is a chart of soybeans, pink line is bracket hi-lo, with breakout yesterday above bracket hi...
Click image for original size
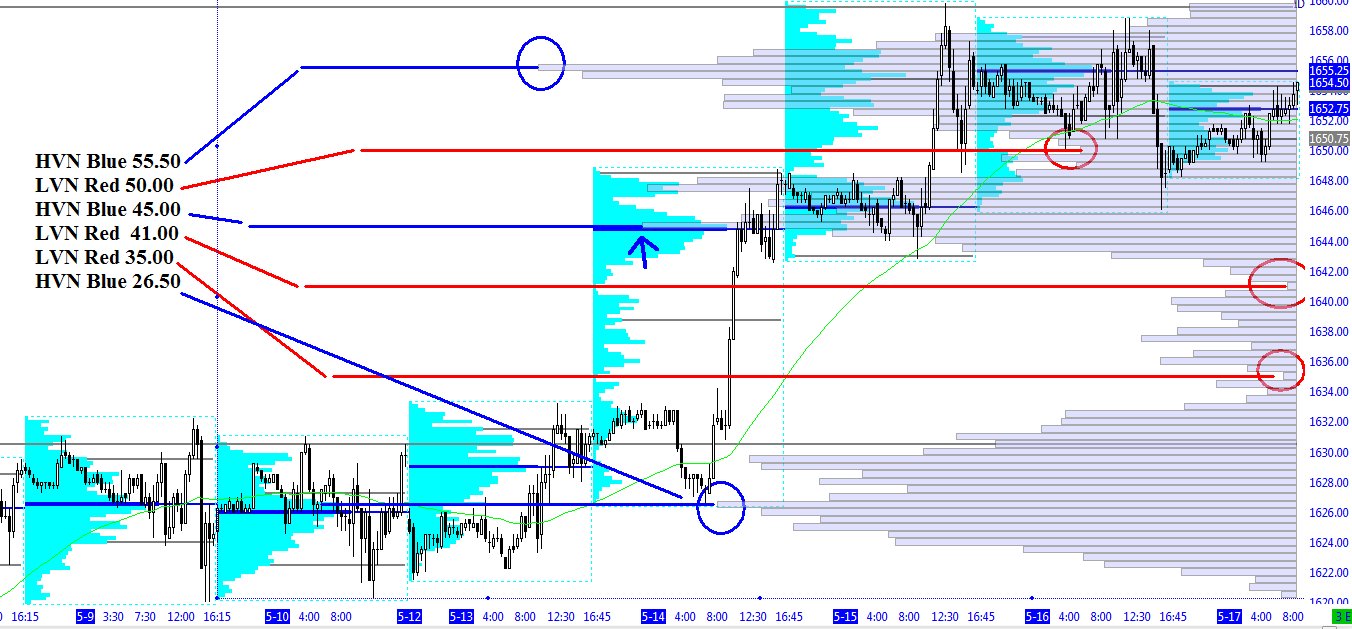
Here you go,
5 days, 24 hour prices (including what has happened so far today)
DTNIQ feed
Sierra Charts
aligned the volume profile to the right
5 days, 24 hour prices (including what has happened so far today)
DTNIQ feed
Sierra Charts
aligned the volume profile to the right
Click image for original size
great stuff posted above and nice summary MM..hope others join the party...
one thing I forgot to mention on the video is that the entire overnight is long based on it's price action compared to yesterdays closing price. some think that the inventory of the overnight needs to be corrected before any meaningful rally happens.
So it would be nice to see them try a push down first in the day session to correct some if not all of that long inventory.....and then bring it back up ..just a thought
I think fades off the VA highs if they come are more aggressive as we have multiple tops above there and we are in a bull market..
you can combine Wednesday and thursday into one profile if it paints a better picture..we have consolidated between 48 and 58 so we may trend out and away from here...keep it in perspective and shorts above 58-60 will be lighter as I donot want to get caught in a real breakout higher
opened in Value and drop down to the VA low to the tick..I missed the long as I wanted lower prices...
On a small higher risk short up here looking for a 56 retest before they run out the hour high...slow so far and this is my first trade...90 minute are almost up..plus 4 - 5.5 zone was up above that double high for confluence but still high risk
On a small higher risk short up here looking for a 56 retest before they run out the hour high...slow so far and this is my first trade...90 minute are almost up..plus 4 - 5.5 zone was up above that double high for confluence but still high risk
I have no runners left as this is just about 4 points under the swing highs today...the extreme of most small moves...also the magnet price.55 - 56 .....that's all for me today...hope it's a great weekend for everyone
Little bit of a head and shoulders pattern today in the price action depending on your time frame.
Not sure if it means anything yet.
Not sure if it means anything yet.
I can't seem to get Volume Profile on Tradestation. Every time I talk to them on this issue, they seem dumbfounded.
Any ideas?
Any ideas?
Originally posted by Jeffomni
I can't seem to get Volume Profile on Tradestation. Every time I talk to them on this issue, they seem dumbfounded.
Any ideas?
Hit Youtube and type in "Tradestation Volume Profile." There are several vids there describing how to create a Volume Profile in TS. Here's one that is simple and well described. I was able to replicate it in TS:
Thanks. I just set up
YW. Don't know about all of the different inputs and how it could or should adjusted etc. Other Youtube vids looked like they had a variety of "input" numbers. If anyone here knows what might be the best way to set up VolProf in TS ... espec. based on the above vid instructions, feel free to post ideas.
Emini Day Trading /
Daily Notes /
Forecast /
Economic Events /
Search /
Terms and Conditions /
Disclaimer /
Books /
Online Books /
Site Map /
Contact /
Privacy Policy /
Links /
About /
Day Trading Forum /
Investment Calculators /
Pivot Point Calculator /
Market Profile Generator /
Fibonacci Calculator /
Mailing List /
Advertise Here /
Articles /
Financial Terms /
Brokers /
Software /
Holidays /
Stock Split Calendar /
Mortgage Calculator /
Donate
Copyright © 2004-2023, MyPivots. All rights reserved.
Copyright © 2004-2023, MyPivots. All rights reserved.