Moving Average Convergence Divergence MACD
Search Dictionary
Definition of 'Moving Average Convergence Divergence MACD'
MACD is the acronym for Moving Average Convergence Divergence. This is a trend-following (Lagging Indicator) momentum indicator. The MACD is plotted in a separate pane below the chart because it shows the difference between two moving averages and therefore will have a different price scale to the security or future being plotted.
The MACD is a Technical Indicator (as opposed to an Economic Indicator).
The typical (default) settings used on the MACD are 12, 26, 9, C. This means that the fast moving average (MA) is a 12 period EMA, the slow MA is a 26 period EMA, the signal line uses a 9 period EMA, and the data points are taken off the closing price.
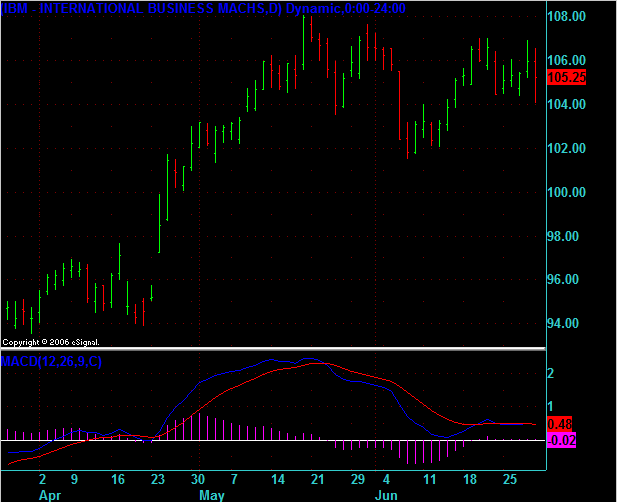
In our example, the blue line is the MACD line. This line is showing the value of the 12 EMA minus the value of the 26 EMA. If the blue line is above the white center line then the faster EMA (in this case the 12 EMA) is above the slower EMA.
The red line is the 9 EMA of the MACD. A signal is generated when this line crosses the MACD line. The fuchsia histogram that you see on the chart shows the MACD value minus the Signal Line line value. Most traders are only interested in the crossover of this indicator, as such they often switch off the MACD and Signal lines and just watch the histogram's relationship to the center line (white) which is also often referred to as the zero line.
There are three ways in which the MACD is commonly used:
The MACD is a Technical Indicator (as opposed to an Economic Indicator).
The typical (default) settings used on the MACD are 12, 26, 9, C. This means that the fast moving average (MA) is a 12 period EMA, the slow MA is a 26 period EMA, the signal line uses a 9 period EMA, and the data points are taken off the closing price.
In our example, the blue line is the MACD line. This line is showing the value of the 12 EMA minus the value of the 26 EMA. If the blue line is above the white center line then the faster EMA (in this case the 12 EMA) is above the slower EMA.
The red line is the 9 EMA of the MACD. A signal is generated when this line crosses the MACD line. The fuchsia histogram that you see on the chart shows the MACD value minus the Signal Line line value. Most traders are only interested in the crossover of this indicator, as such they often switch off the MACD and Signal lines and just watch the histogram's relationship to the center line (white) which is also often referred to as the zero line.
There are three ways in which the MACD is commonly used:
- Crossovers: When the MACD crosses from above to below the signal line this is generally a sell signal. It is often easier to look at the histogram than the lines. To restate this signal in terms of the histogram we would say that when the MACD histogram becomes negative this is a sell signal and when it moves to the positive side of the white center line it's a buy signal.
- Divergence: When the MACD histogram is making a higher high and the price is making a lower high then we have divergence. This also applies to lower lows on the MACD histogram and higher lows on the price. When the price peaks diverge from the MACD peaks on the highs this indicates a short. When the price troughs diverge from the MACD histogram on the lows then this indicates a long signal. (For a detailed discussion on divergence read Divergence and Quality of Divergence)
- Steepness: A very steep change in the MACD histogram indicates the possibility of an overbought or oversold market. Traders will typically attempt to identify the peak or trough in this type of price movement by using timing techniques in order to fade the end of this radical move. The unusual steepness of the MACD histogram is the trader's signal that we are in an extreme movement that may return to normal levels once completed.
Do you have a trading or investing definition for our dictionary? Click the Create Definition link to add your own definition. You will earn 150 bonus reputation points for each definition that is accepted.
Is this definition wrong? Let us know by posting to the forum and we will correct it.
Emini Day Trading /
Daily Notes /
Forecast /
Economic Events /
Search /
Terms and Conditions /
Disclaimer /
Books /
Online Books /
Site Map /
Contact /
Privacy Policy /
Links /
About /
Day Trading Forum /
Investment Calculators /
Pivot Point Calculator /
Market Profile Generator /
Fibonacci Calculator /
Mailing List /
Advertise Here /
Articles /
Financial Terms /
Brokers /
Software /
Holidays /
Stock Split Calendar /
Mortgage Calculator /
Donate
Copyright © 2004-2023, MyPivots. All rights reserved.
Copyright © 2004-2023, MyPivots. All rights reserved.