3 Days of Unfilled Gaps in the ES
3 Day Unclosed Gap Study
This article was written on 17 June 2007, a Sunday. During the previous week, the E-mini S&P 500 (the ES) had 3 back-to-back unclosed gap days on Wednesday, Thursday, and Friday, (13 June 2007 to 15 June 2007 inclusive).
The questions that everyone wants answered are:
- Has this happened before?
- If so, what did the market do on the fourth day?
To answer these questions I pulled RTH (Regular Trading Hours) data out of my data base of prices since the ES start trading which dates back to 2 April 1998. The closing price that I used for each day was the last traded price and not the settlement price. RTH is from 9:30am to 4:15pm ET.
My first look through the data showed me that we have had 40 runs where there have been 3 unfilled gaps in a row and 9 times there have been 4 unfilled gaps in a row. When I started looking at the data I realized that many of the patterns were not like the recent one that we had just seen which was a continuously up pattern of a micro-bull phase. Many of these gaps included both up and down gaps in the 3 or 4 unfilled gap run.
Only unfilled gaps in an up pattern
Because I am only interested in finding out what might happen on the fourth day in this particular pattern (the up/bull pattern) I filtered out all unfilled gap patterns except those where the gaps were above the previous session’s close. This reduced the number of 3 unfilled gap runs to 5, including the run from last week. There were no up-runs of 4 or more.
Here are the dates of the third day:
- 29-Oct-1999
- 5-Nov-1999
- 27-Nov-2000 (includes a Thanksgiving Day)
- 1-Nov-2005 (includes a Fed Day)
- 15-June-2007
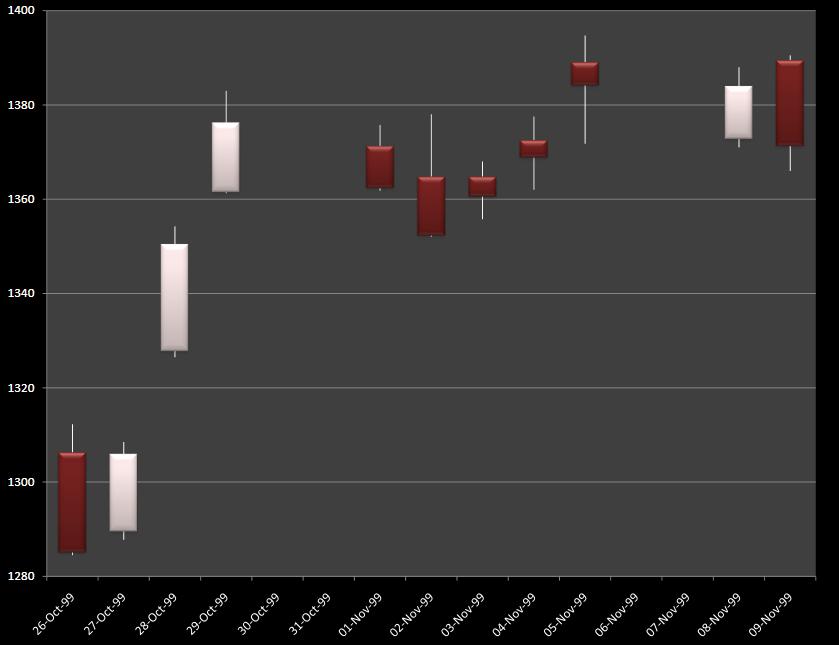
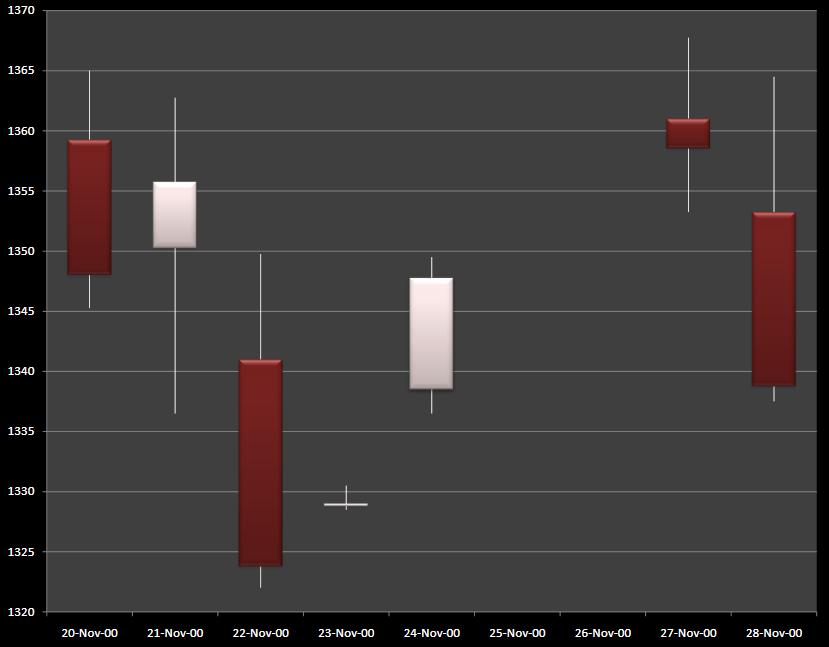
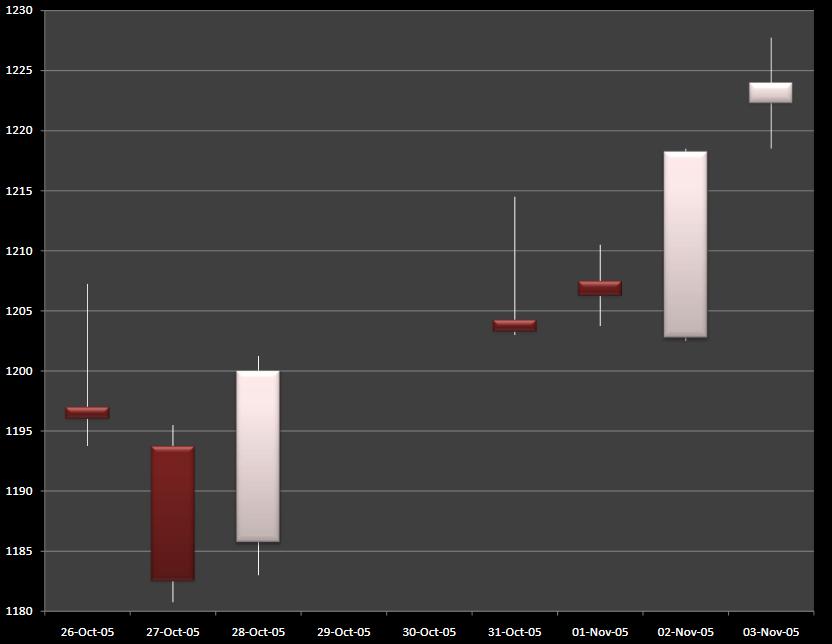
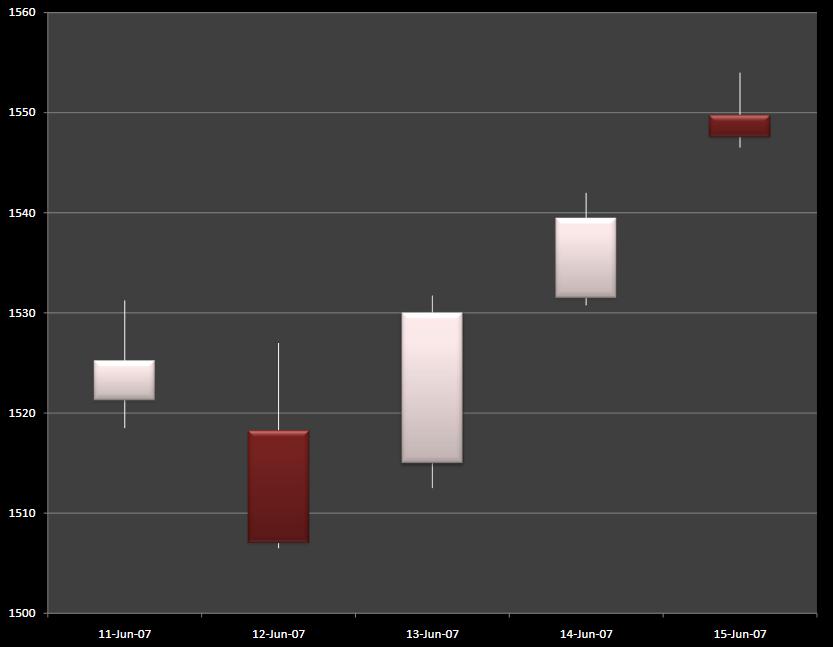
I’ve created 4 charts to show you the ranges above including a couple of days before and after where appropriate.
29-Oct-1999 & 5-Nov-1999
This chart covers both of these runs as they were so close together. In my opinion, the 3 day unclosed gap run that most closely matches the current (15-June-2007) gap run is the first pattern on this chart. The second pattern, although the gaps are all up-gaps, the days had their closes below their opens.

27-Nov-2000 (includes a Thanksgiving Day)
Because this pattern happened with Thanksgiving Day right in the middle of it I do not believe that it is reliable to use this pattern because of the low volume distortion crated by Thanksgiving Day.

1-Nov-2005 (includes a Fed Day)
This pattern is probably the second best match to the current (15-June-2007) gap run but the third candle from the right on this chart is an FOMC Fed Day which needs to be considered.

15-Jun-2007 (most recent pattern)
This is the current 3 unclosed gap run (at the time of writing this).

If you wish to comment on this article or ask questions about it then please do so in the forum. If you are a member of the forum with emails enabled then you would have received an email letting you know as soon as important articles like this are published.