Spikes
Anatomy of a Spike
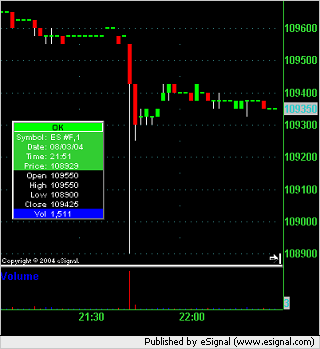
On Tuesday, 3 August 2004 at 21:51 EST in after hours trading the ES spiked down 6.50 points. Here is the 1 minute ES chart showing how on that minute the price opened at 1095.50 and closed at 1094.25 (-1.25 points) after having been down 6.50 points. A total of 1,511 contracts were traded in that minute.
What makes a spike in the ES like that?
This spike is a small one and is after hours with low volume relative to RTH trading and as such makes an ideal candidate for a forensic analysis. Below are a number of time and sales printouts in chronological order. I have annotated each one of them with what I think happened. (i.e. This is my version of the truth - or at least what I read in this.) All times are EST.
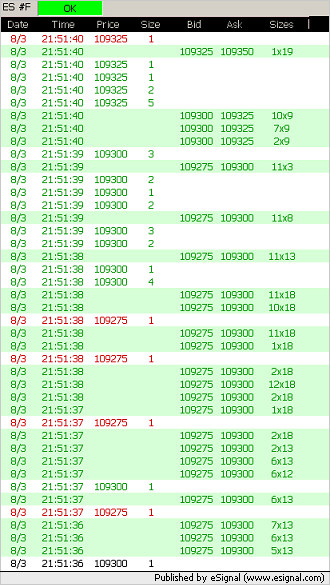
Remember that when reading the time and sales printouts to read from the bottom up. The prices are pushed down the screen as they occur.
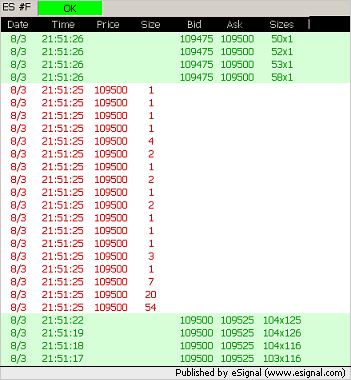
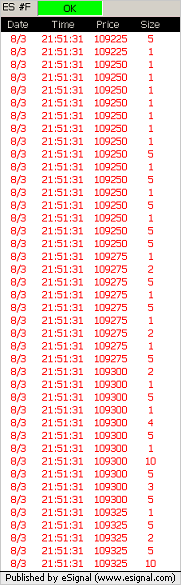
For whatever reason, 105 contracts where sold at market or offered at a limit of 1095.00 in 19 trades. We see that 18 trades totaling 104 contracts (the 104 that had been bid at 1095.00) hit the market at 21:51:25 and the last trade/contract is shown at 21:51:26 as the 1 contract left on the offer side at that time.
If we use a Depth Of Market (DOM/DOME) screen then we are able to see the number of orders bid and asked (offered) at the five closest prices to the last traded price. What we can't see are the number of resting stop loss orders. In my opinion, and for whatever reason, a lot of traders had their stop loss sell orders sitting at 1094.75. This means that once this price is traded (touched) then their orders are released into the market as market orders to sell their positions. I know that I talked to at least 2 traders the following morning that had stop loss orders at 1094.75. It just so happened that everyone thought that this was a good place for a stop loss. Perhaps it was an important pivot number.
So what we see is 1 single contract being sold at market (or limit of 1094.75) at 21:51:31 and the touching of that price caused all these other resting stop orders to be released into the market which end up being "sell at market orders."
Anatomy of a Spike (cont.)
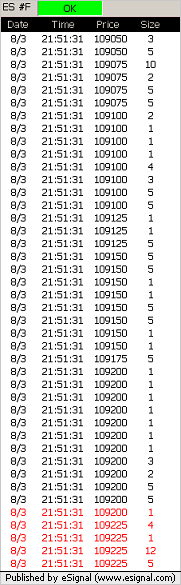
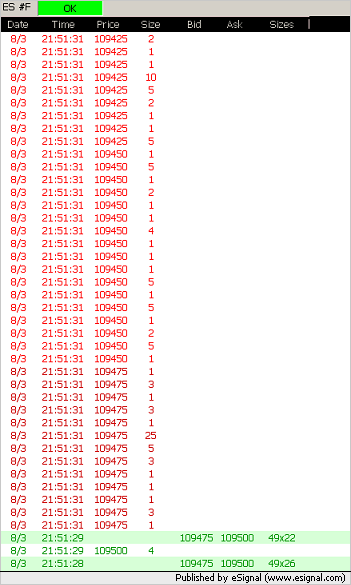
These print outs show you the action in that 1 second
recorded as 21:51:31. At the top of this page I state that the
price of the ES dropped 6.50 points (0.6%) in one minute. If you
take the first traded price at 21:51:31 as 1094.75 and the low
during that second of 1089.00 then we see that the ES actually
dropped 5.75 points (0.53%) in one second.
(For your information, the red prices are where the ES is
being traded at the bid and the black prices are where it's being
traded inside the bid/offer.)
As all the bids at each price level are traded and the next
price down is touched it causes more stop loss orders to hit the
market causing a cascading effect.
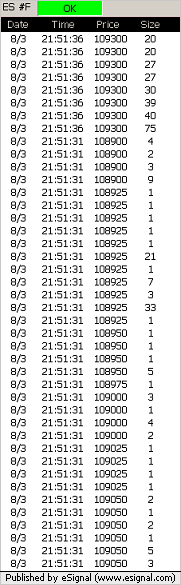
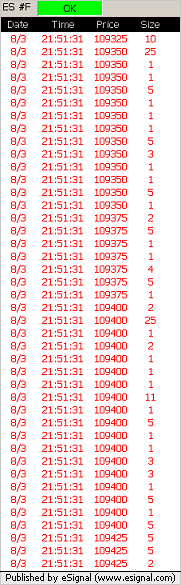
Within 9 seconds of that drop the market regains equilibrium and comes to rest with a bid/offer 4.25/4.50 points above the low 9 seconds earlier.
So you've seen what happened. You've heard my version of what I believe happened. Do you think this is what happened? Do you think something else happened here?
Protecting our positions
How can we protect ourselves from needlessly being stopped out if we're long?
Very difficult question to answer. I use the term hard stop to refer to a stop loss order that is placed in the market and a soft stop as one that you execute yourself by calling your broker or hitting the buy/sell button.
The problem with leaving a position on overnight is that you have a predefined maximum loss that you're prepared to tolerate/risk on this position. If unexpected news hits the market then a price shock will cause the markets to move unexpectedly in a certain direction and by an unexpectedly large amount. This will cause a spike. We don't know if there is going to be a recovery from that spike or not.
In this case we have a spike caused by cascading stops being hit. It all happens in one second and five seconds later the market is already recovering. So this spike was caused by hard stops being left in the market. Unless you were sitting glued in front of your screen you wouldn't have been able to execute a soft stop before the market had already recovered.
So for your average trader there isn't much of a solution. Your choices are:
- Place a hard stop before you leave the trading room.
- Stay in front of the screen all night with your finger over the sell/buy button (soft stop).
- Don't use stops (dangerous).
Traders that use hard stops overnight often use soft stops during RTH while at their trading screens. This allows them to move the stops and quickly reverse positions if the structure (signals) of the market changes. This will prevent traders getting stopped out if this sort of action happens in one second in RTH. However, this sort of action (cascading stops) is unlikely to happen in RTH because the traders that were using hard stops overnight are using soft stops during the day.
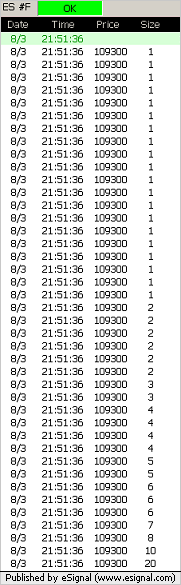
Notice how most of the orders that went through during this one second were small orders. During that one second the largest single order was for 33 contracts. So where were all the big traders? Where were all the traders who were holding 250 contracts long overnight? Why weren't their orders triggered? Don't they use stops? Half a percent move in the ES in one second is a big move. Half a percent move in any market in one second is enormous.
I don't have the answers to these questions but I can take some guesses.
The bigger players have traders or themselves watching the market and are using soft stops. They see the small orders flowing through the market as a result of stops being hit and they "know" that it's an overreaction and that it will recover and so sit tight and wait. Do you see how five seconds later the next nine orders to go through the market (at a higher price so I assume that is buying action) are each for 20 contracts or more, the largest being 75 contracts.
It's also possible that the bigger and more sophisticated traders have bots (robots) watching the market for them and telling them what the anatomy of the spike is. The software can see that the trades causing the spike (1) are small (2) happen in one second and (3) didn't happen in other electronic markets such as the NQ. [The move in the NQ from open to low in this one minute was 1.00 point or the equivalent of 0.07%] These bots can be programmed to release orders into the market and if they "see"that the move down is caused by large volume, over a wider time period and in all markets they will start issuing orders to close out positions without human intervention. This of course will exacerbate the move just like the cascading stops did in this case.
Making money from the spike
How can we take advantage of it and make money if we're not in a position?
If you're at your trading screen and you hear your alarms go off and manage to work out what had happened then you could buy the market like the handful of traders five seconds later did.
If you have automated trading software with built in rules such as those discussed above it could buy the market for you.
Feedback
I've had some feedback since I published this and have decided to add my opinions on that feedback here to keep this article in one place and answer further questions.
Fat Finger
Some people have suggested that this spike is the result of a Fat Finger.
First off, what is a fat finger? A fat finger is when someone accidentally buys/sells more contracts than they intended to. It's called a fat finger because when they type in the number of contracts to buy/sell their finger hits an extra number or two and they end up buying/selling 10 or 100 times more contracts than they intended. If someone wanted to buy 1 contract and accidentally bought 10 or 100 this won't affect a market such as the ES (much). However, if the order was for 1,000 contracts and they executed 10,000 or 100,000 then this would cause all the resting bid/ask orders to be absorbed into that one order for many price levels and the effect would be exacerbated by the fact that many stop orders would then flood the market as well adding to the selling/buying pressure.
Fat finger spikes do happen and look just like this spike. However, I do not believe that this was a fat finger spike and here's why:
A fat finger spike starts with an abnormally large number of contracts hitting the market and being executed at the start of the spike. So how can we tell if that happened in this case? Well at 21:51:29 there were 4 contracts bought at 1095.00. Then at 21:51:31 we have 1 contract sold at 1094.75 and subsequently a number of small groups of contracts hitting the market at 1094.75. These (in my opinion) are stops being triggered. If this had been a fat finger then we would have seen all the orders that were bid at 1094.75 being absorbed into a single trade that was hit at that price.
So at 21:51:29 we have a bid/offer size of 49 x 22 contracts. This means that there were 49 contracts bid at 1094.75 and 22 contracts offered at 1095.00. We can see this on the Time and Sales printout above. If a fat finger trade had been executed (let's assume a fat finger of 200 contracts - which isn't really much but enough for this hypothesis and obviously any number larger than 49 will work here) then we would have seen the full 49 contracts that were being offered at 1094.75 absorbed in 1 single trade at that price at that time. Likewise it would have also absorbed all the orders at 1094.50 and 1094.25 etc. as single orders equivalent to the size that was bid at that price and you wouldn't see lots of small orders being released into the market as we have in this case.
Remember that the market order to sell at 1094.75 will be executed before any stops are released into the market. So the CME order processing system can't say: "hey, there's a sell order at market (1094.75) coming in let me execute the stops first." Stops are triggered by a price being touched and that price can only be touched if orders are executed at it.
So if 49 contracts had been executed at 1094.75 in one trade then I would say that yes, it could have been a fat finger. In this case we can see that it was a series of lots of little orders which look like stop orders being released into the market and cascading stops to lower levels.
Running the stops
This is also the reason that you cannot (and will never be able to) see the resting stops in the market but only the resting limit orders. If you could see both and you noticed that stops outnumbered limit orders then it would be easy for a trader with enough buying/selling power (or an automated system) to run the stops. In this case we know that all that was required to run the stops was the execution of 1 sell order at 1094.75. This means that there were stop orders for at least 49 contracts at that price and only 49 limit orders. The 49th contract that couldn't execute at 1094.75 sold one tick lower at 1094.50 and this caused all the stops to be executed at this level and so on all the way down to 1089.00.
Where are stops held? It is my understanding that stops can be held in one of four places. If this is wrong then please could someone correct me . I am now talking specifically about trading the e-mini S&P. Those four places are:
- The CME order execution server at the exchange.
- The broker's server.
- The client's (trader's) computer.
- The client's (trader's) head. (The trader must physically click a button to execute an order at market to close his/her position.)
Let's for a moment assume that we do know where the stops are and that they are published by the exchange, in this case CME. So we can see all the stop orders that are sitting on the CME server but obviously not any of the stop orders from the other 3 sources which will obviously increase the number we see. I've created a hypothetical DOM/DOME screen live trade table below:
| Stops | Bid | Ask | |
|---|---|---|---|
| 1095.00 | 22 | ||
| 49 | 49 | 1094.75 | |
| 21 | 20 | 1094.50 | |
| 33 | 2 | 1094.25 | |
| 91 | 70 | 1094.00 | |
| 27 | 23 | 1093.75 | |
| 81 | 33 | 1093.50 |
The time is 21:51:29 and the price of 1094.75 has not been touched yet. You are a trader watching the screen and you suddenly see that at every level from 1094.75 the stops either equal or outnumber the limit order at every level from 1094.75 down to 1089.00. All you need to do in order to create a cascade effect and run the stops is to execute a sell of 1 single contract at 1094.75 and then the 49 contracts that are stop triggers at that level will hit the other 48 bid at that level and the last one will cascade into the 1094.50 level and trigger those stops and so on.
You are a very small trader and only trade 1 contract so you put in a bid at 1089.25 (because the stops cease to outnumber the bids at 1089.00) and then you sell 1 contract at market (1094.75) and in one second you make 5.50 points. Perhaps you put in a 2 contract bid at 1089.25 because you "know" that the market is going to reverse to equilibrium because this is a stop run and not a fundamental shift in the market caused by a news event. So you make your 5.50 points on the way down and a number more points on the way up.
If a 1 contract trader could do this to the market with this sort of knowledge imagine what sort of chaos a big player could cause by running the stops. In my opinion, a 1 contract trade at market caused this move/spike although I can't believe that the trader that executed that 1 contract knew that there were that many stops that were going to hit the market as a result. I'm sure that he/she would have sold a few more contracts if he/she had known.
Copyright © 2004-2023, MyPivots. All rights reserved.