MP Spoos long term chart as at close June5th
Click image for original size
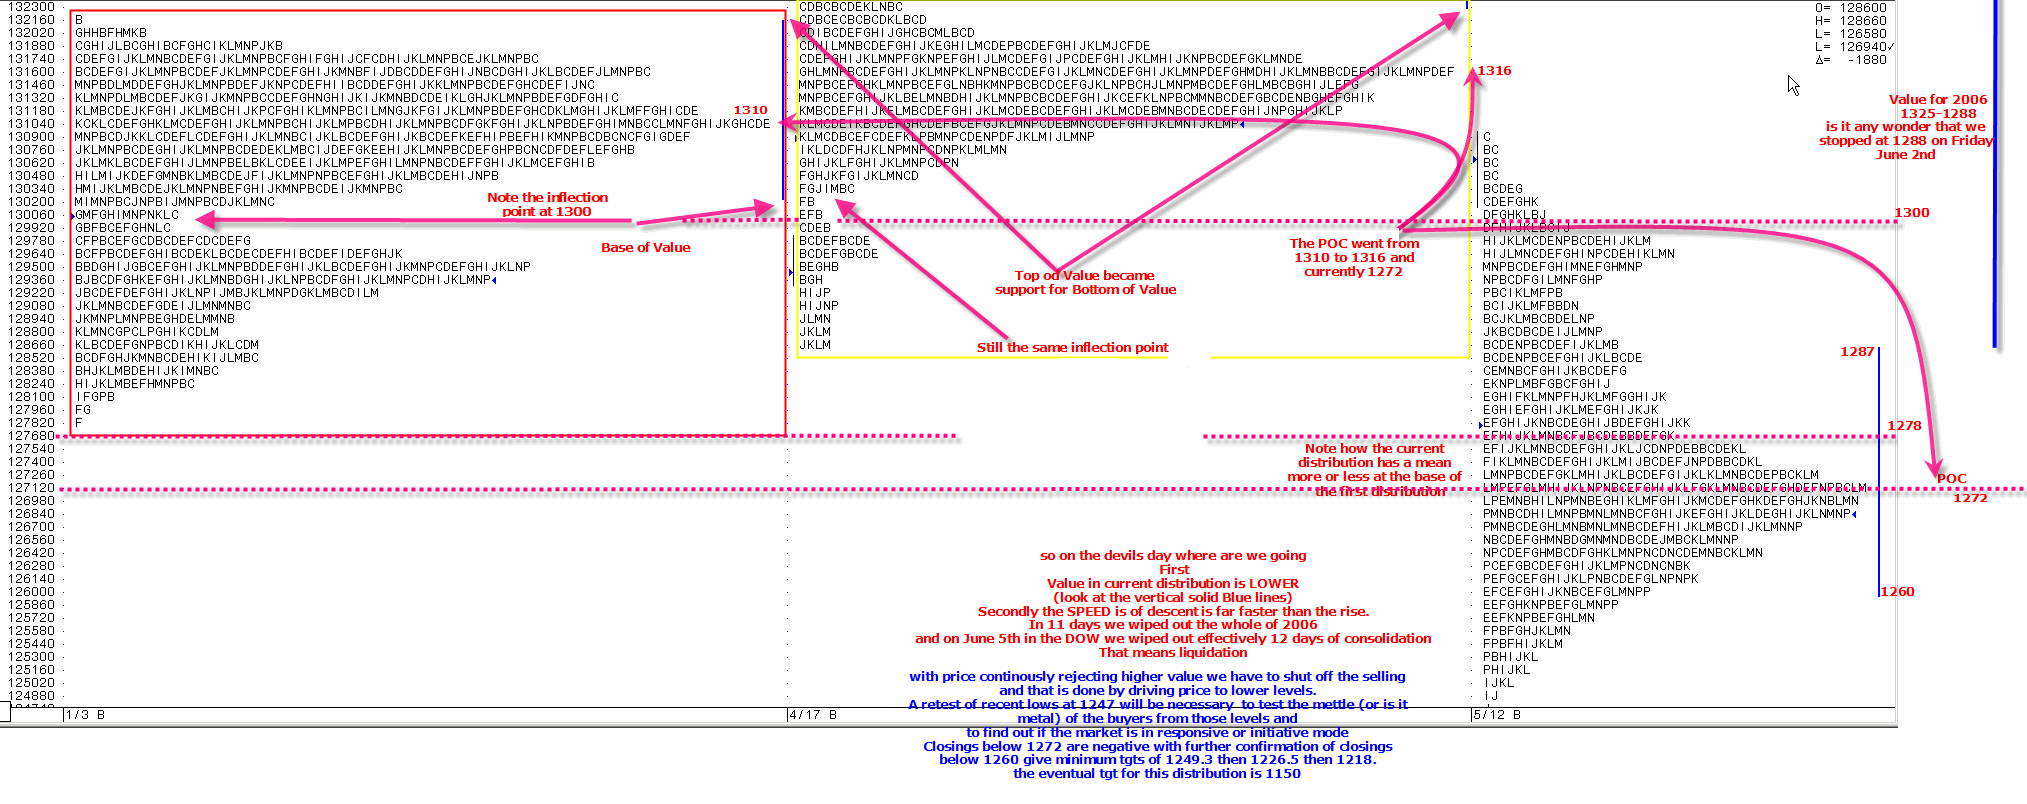
Alley: You've created 3 profiles in the chart above. I can see how you picked the start date for the 3rd profile but how did you determine the cut-off between the 1st and 2nd profiles?
Thought that might wake you up. lol where have you been last few days?
April 17th is the cut off tween the two profiles. April 17th was a significant ending of a distribution.
April 17th is the cut off tween the two profiles. April 17th was a significant ending of a distribution.
I would have used 11 April - for me that was the break of the previous congestion.
fair enough comment. April 11th to april 17th was a market going no place. that just shows that everyone is different and that is exactly how the market is made up. for me the open unchanged on the 18th and drive higher was the telltail sign thats all, whereas on the 11th yes the market effectively failed to continue. frankly don't think it makes little difference to what I was trying to show. IE value is lower than previous and pushing lower that in space of a matter of days we had a speed move that did not punish badly positioned, or affect the undercapitaised but wiped out wealth. Take a look at the Nasdaq or even over in the Dow and you will see much more serious erosion of value
Emini Day Trading /
Daily Notes /
Forecast /
Economic Events /
Search /
Terms and Conditions /
Disclaimer /
Books /
Online Books /
Site Map /
Contact /
Privacy Policy /
Links /
About /
Day Trading Forum /
Investment Calculators /
Pivot Point Calculator /
Market Profile Generator /
Fibonacci Calculator /
Mailing List /
Advertise Here /
Articles /
Financial Terms /
Brokers /
Software /
Holidays /
Stock Split Calendar /
Mortgage Calculator /
Donate
Copyright © 2004-2023, MyPivots. All rights reserved.
Copyright © 2004-2023, MyPivots. All rights reserved.