Year End Summary 2006
2006 returns for some of the more popular traded symbols:
And some weekly charts showing these instruments over the year 2006 and including 2005 so that you can do a year on year comparison.
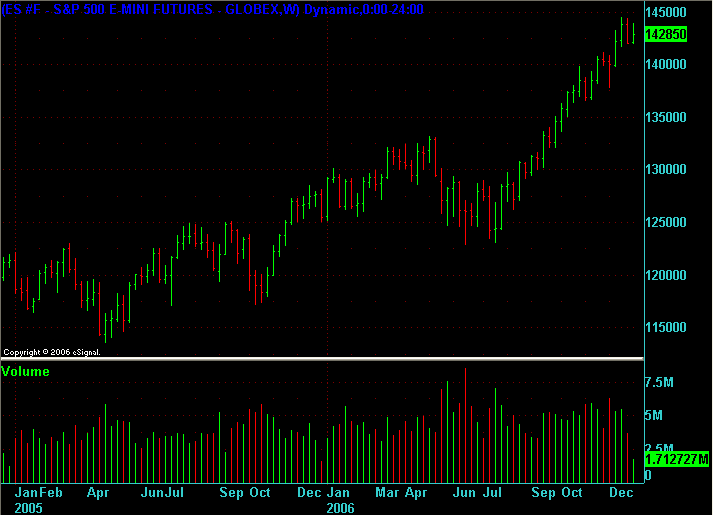
E-mini S&P500
E-mini Russell 2000
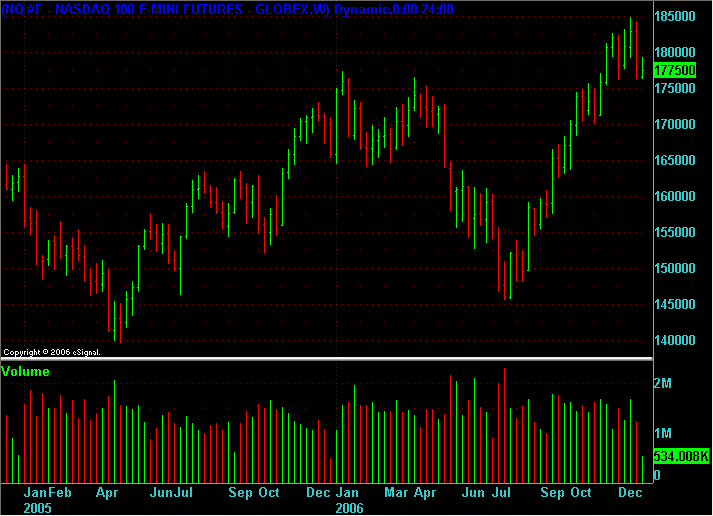
E-mini Nasdaq-100
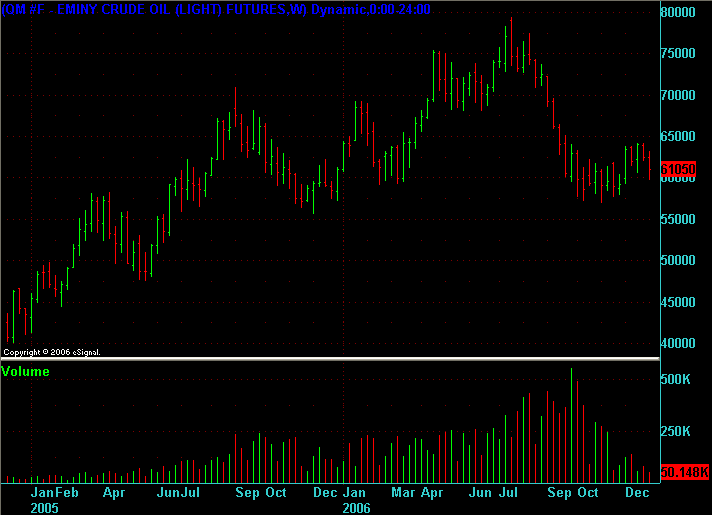
miNY Light Sweet Crude Oil
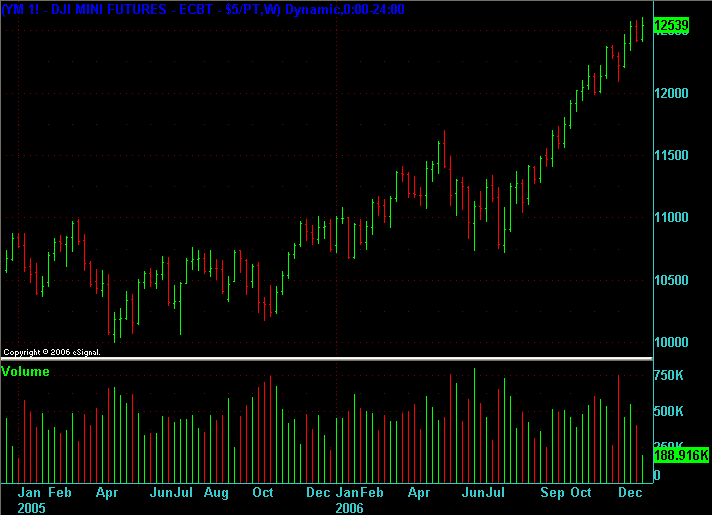
mini-Sized Dow Jones Industrial Average (DJIA)
30 Year U.S. Treasury Bonds Futures
        2005      2006  Return

       Close     Close       %

NQ   1659.00   1775.00    7.0%

ES   1254.75   1428.50   13.8%

YM     10744     12539   16.7%

QM     61.04     61.05    0.0%

ZB    114-06    111-14	 -2.4%
And some weekly charts showing these instruments over the year 2006 and including 2005 so that you can do a year on year comparison.
E-mini S&P500
Click image for original size
E-mini Russell 2000
Click image for original size

E-mini Nasdaq-100
Click image for original size
miNY Light Sweet Crude Oil
Click image for original size
mini-Sized Dow Jones Industrial Average (DJIA)
Click image for original size
30 Year U.S. Treasury Bonds Futures
Click image for original size

Emini Day Trading /
Daily Notes /
Forecast /
Economic Events /
Search /
Terms and Conditions /
Disclaimer /
Books /
Online Books /
Site Map /
Contact /
Privacy Policy /
Links /
About /
Day Trading Forum /
Investment Calculators /
Pivot Point Calculator /
Market Profile Generator /
Fibonacci Calculator /
Mailing List /
Advertise Here /
Articles /
Financial Terms /
Brokers /
Software /
Holidays /
Stock Split Calendar /
Mortgage Calculator /
Donate
Copyright © 2004-2023, MyPivots. All rights reserved.
Copyright © 2004-2023, MyPivots. All rights reserved.