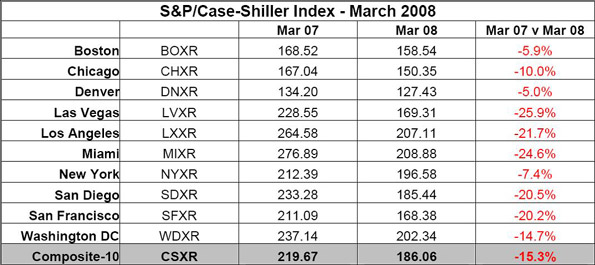
Home Prices Decline More Than 15 Percent
Published May 27, 2008, the S&P/Case-Shiller Index for March 2008 indicates a 15.3% drop in home prices from March 2007 to March 2008 for a composite of ten major U.S. cities, with five of these cities experiencing a decrease of 20% or more.
Have you or do you know of anybody who's traded the S&P/Case-Shiller Home Price Index Futures?
Click image for original size
Have you or do you know of anybody who's traded the S&P/Case-Shiller Home Price Index Futures?
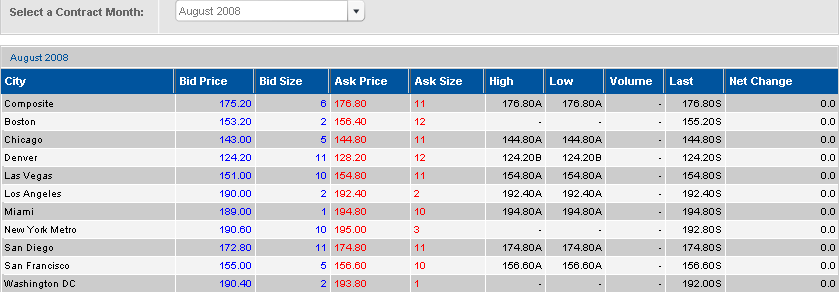
I took some interest in this contract when it first came out and the volume was amazingly thin. I believe it was around 1 to 5 contracts a day. Here is the volume sheet for today (29 May 2008) for the August 2008 contract which shows that the volume, although still small, has increased considerably.
Click image for original size
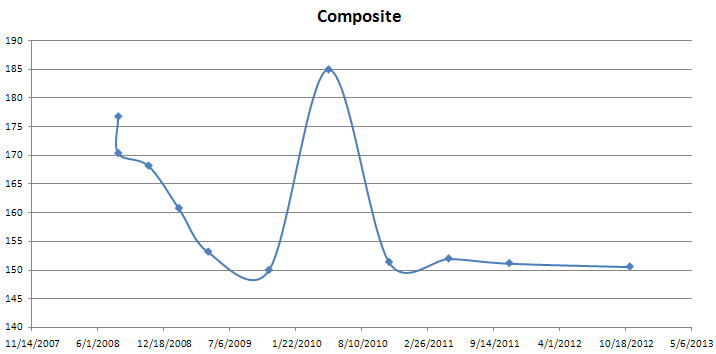
The question that everyone is always asking each other is when will the house prices stop dropping. So armed with the composite futures index price for several expiration dates I charted what the futures market thinks of the future of the housing market. i.e. These are the current prices for expiration on the dates shown on the X-axis.
What is interesting about this chart is that traders are putting their money on the line to establish these prices. This is not a bunch of negative-equity-home-owners or Realtors trying to talk up the market.
I believe that the blip up in the middle of the chart is because no one has traded that contract for a long time and that can be ignored - i.e. no one is really expecting the housing market to jump for a few months and then return back to the lower level.
Click image for original size
Emini Day Trading /
Daily Notes /
Forecast /
Economic Events /
Search /
Terms and Conditions /
Disclaimer /
Books /
Online Books /
Site Map /
Contact /
Privacy Policy /
Links /
About /
Day Trading Forum /
Investment Calculators /
Pivot Point Calculator /
Market Profile Generator /
Fibonacci Calculator /
Mailing List /
Advertise Here /
Articles /
Financial Terms /
Brokers /
Software /
Holidays /
Stock Split Calendar /
Mortgage Calculator /
Donate
Copyright © 2004-2023, MyPivots. All rights reserved.
Copyright © 2004-2023, MyPivots. All rights reserved.