RSI breakouts
Click image for original size
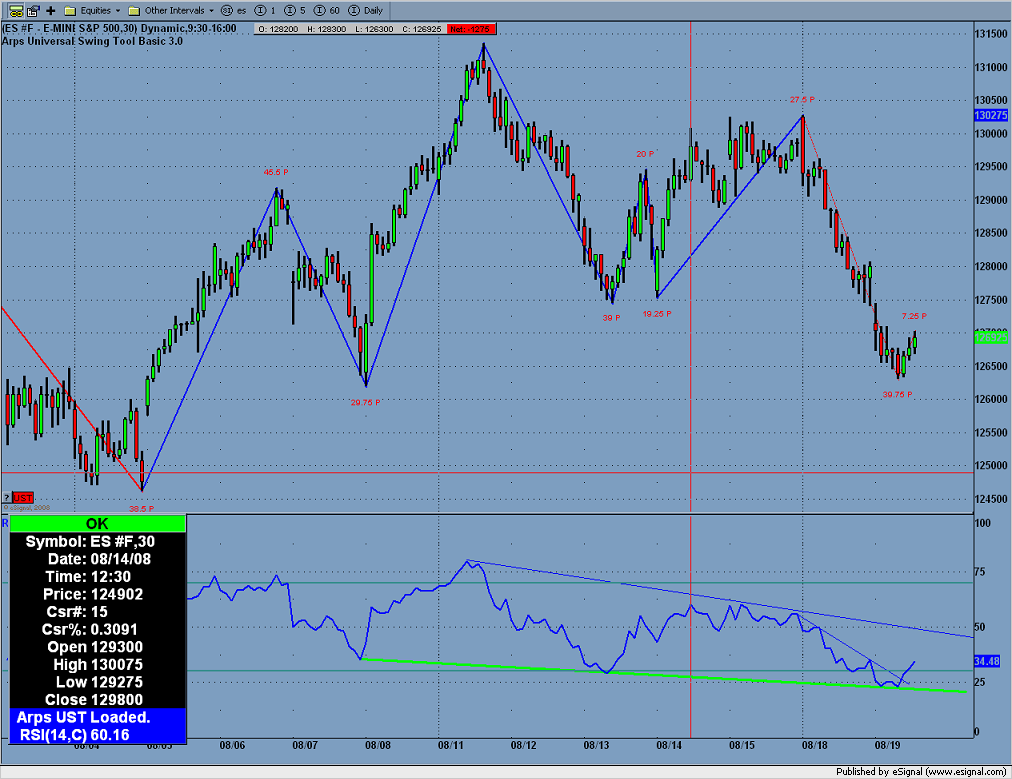
This last little breakout to the upside on the RSI happened when the ES was still around 64 area. And found support twice on the green line drawn from 2 other lows in the RSI. Seems to be forming a wedge which is indicative of a market starting to trend. Any way bounce off support or breakout it yeilded some nice points in the ES today, either way you want to go.
It's a shame that this didn't generate much interest yet but it is summer. I dug up that article
I mentioned and will post a recap with the core ideas sometime on friday.....
I mentioned and will post a recap with the core ideas sometime on friday.....
Ok let me make a quick summary:
Hartle used a 14 period rsi on the daily chart and readings above and below 50 ( Above 50 sets up longs, below 50 sets up short side).
He plotted rsi as a histogram and would look for a reading above 50 that was surrounded on both sides of the histogram with lower readings...to set up long trades. "Ringed" highs in this case.
Rules:
1)Find markets where RSI is above 50 and forms two pivots highs, the first one higher than the second one. ( A pivot high is a high with a lower high preceeding and following it)
2)Draw a horizontal line downsloping connecting the two pivot highs
3)The Rsi must close above the trendline and the price bar must close in the upper half of the range
Enter on the close!!
Stop-loss and exit:
Set initial stop -loss two ticks below the entry bar then trail with a stop below the previous day for the life of the trade..Here is an example of how he would have connected the pivots on the histogram...not a great chart as I have no patience for my I/RT this morning...
Click image for original size
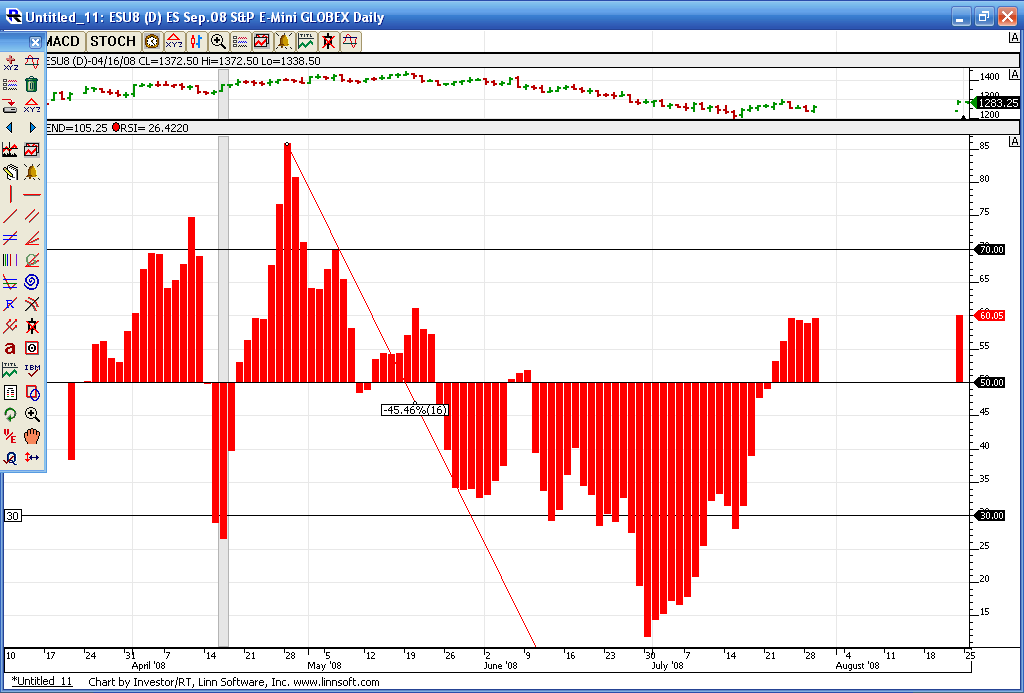
Perrty simple, and looks good. If you drew that trendline from that extream high to the last high before it broke 50.00 it marked the bottom RSI bar. I am going to order this new RSI book...RSI logic or something like that its a rather long book on RSI the author's a S&P futures trader so it ought to be perrty good. Its supposed to be a new way of looking at RSI. I'll post anything good on this thread...
give me the authors name I may have something that might be of interest in soft copy
I think I have something by caldwell or something
RSI; logic, signals and time frame correlation by Walter J. Baeyens. But am interested in anything to do with RSI.
charterjoe
ive been reading your posts about taking phi to the 4th power * price to get price - did you know if you squared said price you will also be able to take said price to time?
you will be able to prove that pythagorean theorem on your post of es 1260 on the 20th of august
im sure you know what im taking about
take care
gio
quote:
Originally posted by gio5959
charterjoe
ive been reading your posts about taking phi to the 4th power * price to get price - did you know if you squared said price you will also be able to take said price to time?
you will be able to prove that Pythagorean theorem on your post of es 1260 on the 20th of august
im sure you know what im taking about
take care
gio
Pythagorean! I was born in the same town were Pythagoras was, (Pythagorion Samos Greece)
Emini Day Trading /
Daily Notes /
Forecast /
Economic Events /
Search /
Terms and Conditions /
Disclaimer /
Books /
Online Books /
Site Map /
Contact /
Privacy Policy /
Links /
About /
Day Trading Forum /
Investment Calculators /
Pivot Point Calculator /
Market Profile Generator /
Fibonacci Calculator /
Mailing List /
Advertise Here /
Articles /
Financial Terms /
Brokers /
Software /
Holidays /
Stock Split Calendar /
Mortgage Calculator /
Donate
Copyright © 2004-2023, MyPivots. All rights reserved.
Copyright © 2004-2023, MyPivots. All rights reserved.