Measuring The Chop
Triangle corrections as Elliot called them are a trend continuation correction, meaning the trend will continue in the direction traded before the triangle interupted price action. They're either orderly or chaotic. Either way, the chop is most trend followers' bane of existence. ATRs, standard deviations, historical volitility.. they help little other than provide a lagging framework in the hopes to scalp. Which way are we?!
But what if I told you it's possible to know exactly where on the chart and at the approximate time a breakout will occur? You'ld think I was crazy right?
We already know that if you're in a trend and a triangle rears its dæmonic head that sooner or later the trend will continue. So there's really no such thing as a false breakout then. Right?
What we need to know is where, and at what approxiamate time, the move will breakout and reverse in a bear and continue on if in a bull. Incidentally I speak of the sort of triangle that manifest themselves in the daily or 240 like we're experiencing now but it works in all charts, some easier moreso than others.
The time factor is not at all difficult but, uh, is time consuming. I'll get to that in a different post for another day. Let's talk about measuring triangle moves first.
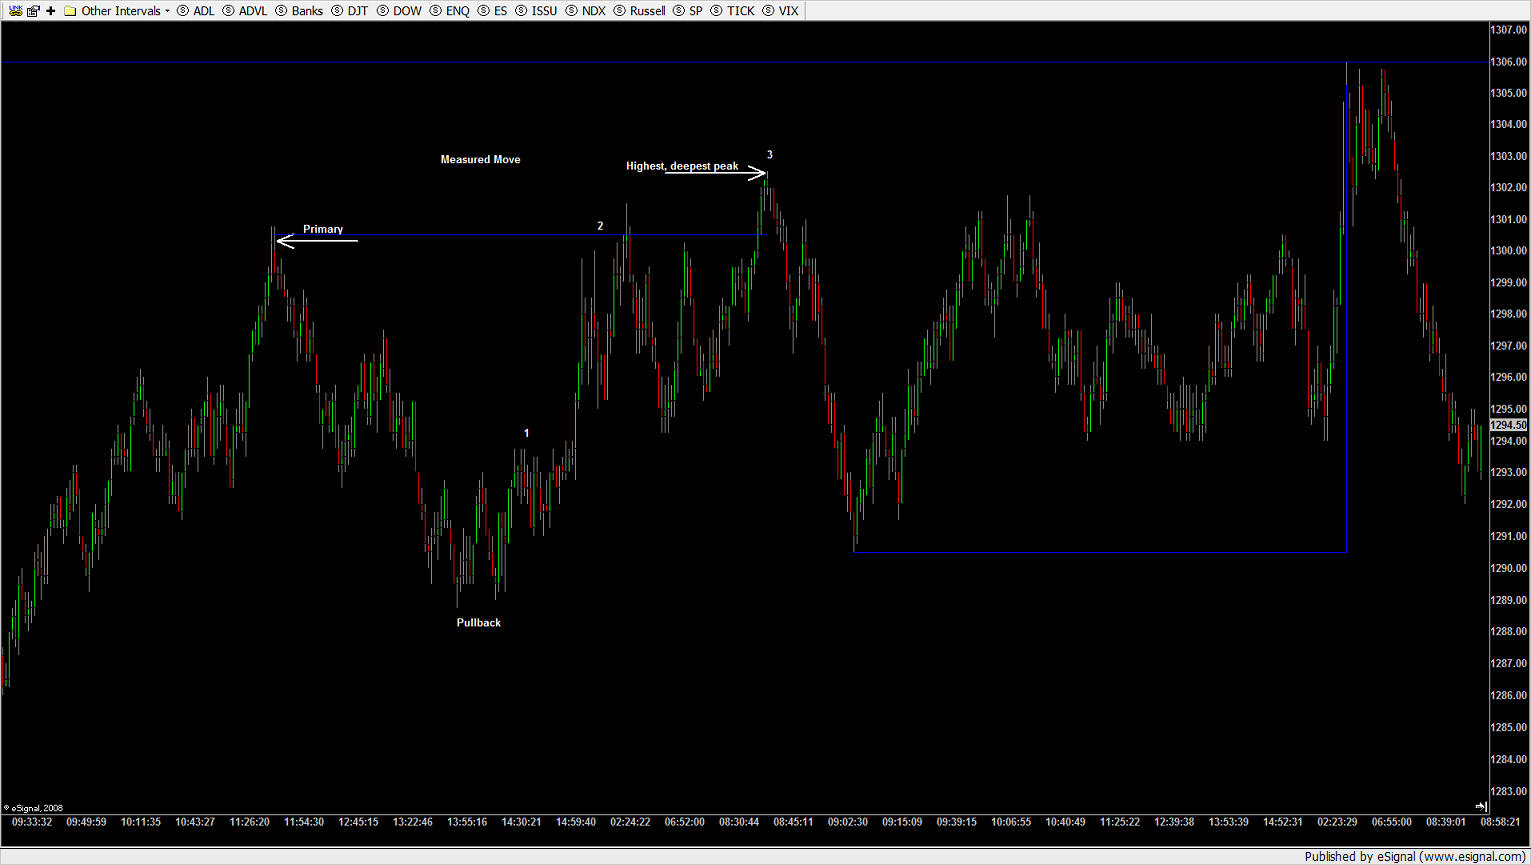
You need a primary movement having completed its first pullback, the subsequent rally and then its completed first measured three peaks, or whichever measured move has the most distance in between them. What you want to do is find the widest section and trace its origination to the candle that began the directional movement. If it's multiple wicks choose only the one directly inline beginning or ending a movement for the impulse in its beginning stages, and its pullback; but find the widest and highest peak for the commencement of the measured move.
Just connect them with a segment, copy and paste the segment at the termination of the correction following the measured move and you have an the exact place the breakout and it's peak will be.
Here's a 610T from last Thursday to Monday premarket:
But what if I told you it's possible to know exactly where on the chart and at the approximate time a breakout will occur? You'ld think I was crazy right?
We already know that if you're in a trend and a triangle rears its dæmonic head that sooner or later the trend will continue. So there's really no such thing as a false breakout then. Right?
What we need to know is where, and at what approxiamate time, the move will breakout and reverse in a bear and continue on if in a bull. Incidentally I speak of the sort of triangle that manifest themselves in the daily or 240 like we're experiencing now but it works in all charts, some easier moreso than others.
The time factor is not at all difficult but, uh, is time consuming. I'll get to that in a different post for another day. Let's talk about measuring triangle moves first.
You need a primary movement having completed its first pullback, the subsequent rally and then its completed first measured three peaks, or whichever measured move has the most distance in between them. What you want to do is find the widest section and trace its origination to the candle that began the directional movement. If it's multiple wicks choose only the one directly inline beginning or ending a movement for the impulse in its beginning stages, and its pullback; but find the widest and highest peak for the commencement of the measured move.
Just connect them with a segment, copy and paste the segment at the termination of the correction following the measured move and you have an the exact place the breakout and it's peak will be.
Here's a 610T from last Thursday to Monday premarket:
Click image for original size
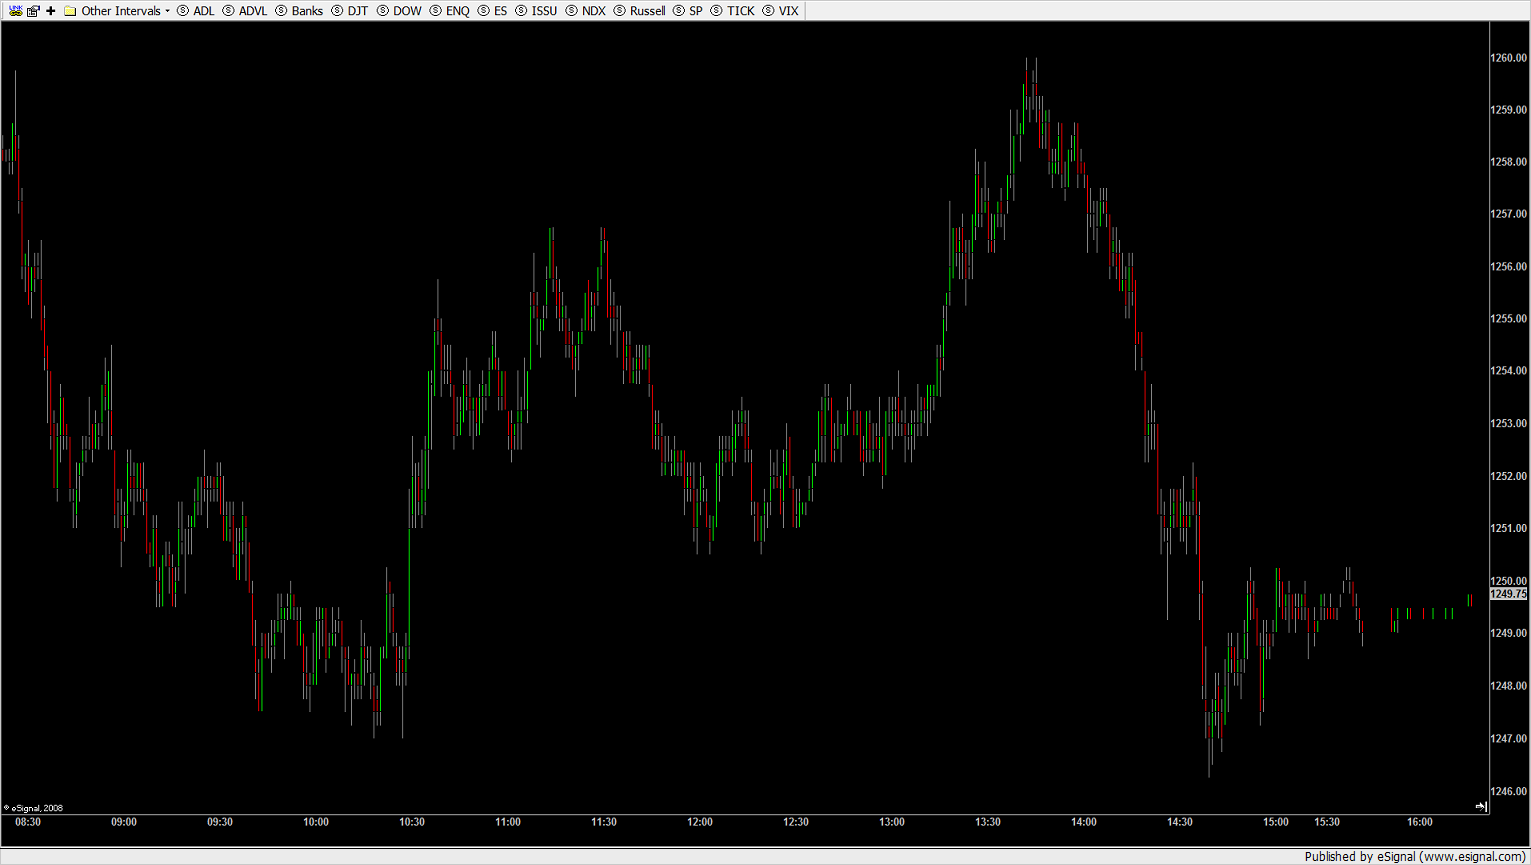
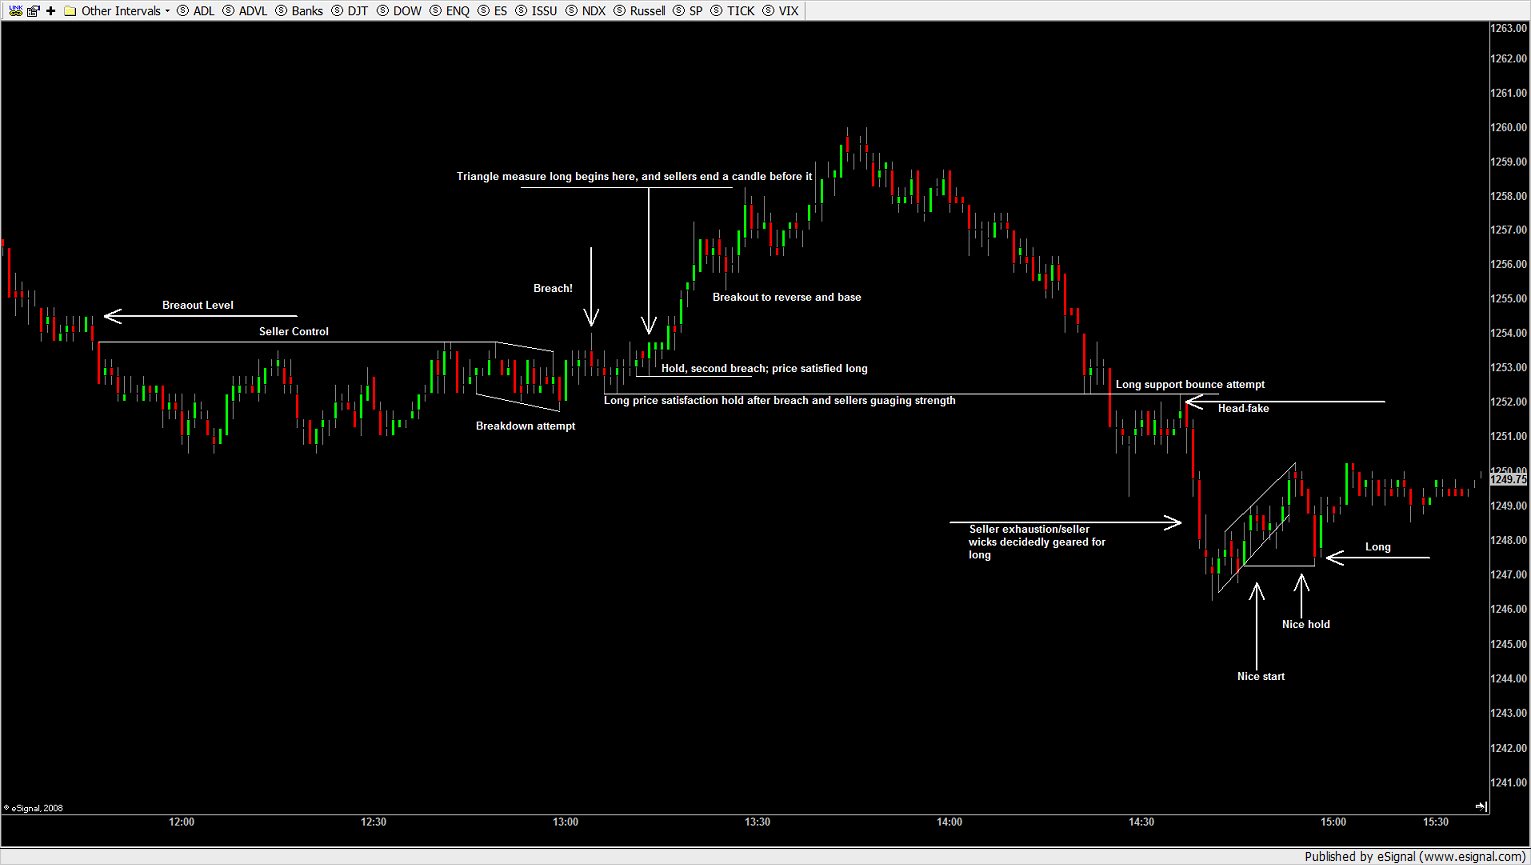
Where does the downside movement end and longs begin in this Chart? Can anyone hard-pressed for worthwhile and meaningful trading discussion on this board tell me?
If no, don't get your knicker's in a ruffle.
If no, don't get your knicker's in a ruffle.
Click image for original size
quote:
Originally posted by SPQR
Where does the downside movement end and longs begin in this Chart? Can anyone hard-pressed for worthwhile and meaningful trading discussion on this board tell me?
If no, don't get your knickers in a ruffle.
Click image for original size
Click image for original size
Emini Day Trading /
Daily Notes /
Forecast /
Economic Events /
Search /
Terms and Conditions /
Disclaimer /
Books /
Online Books /
Site Map /
Contact /
Privacy Policy /
Links /
About /
Day Trading Forum /
Investment Calculators /
Pivot Point Calculator /
Market Profile Generator /
Fibonacci Calculator /
Mailing List /
Advertise Here /
Articles /
Financial Terms /
Brokers /
Software /
Holidays /
Stock Split Calendar /
Mortgage Calculator /
Donate
Copyright © 2004-2023, MyPivots. All rights reserved.
Copyright © 2004-2023, MyPivots. All rights reserved.