Market Mood, aka improved capital adv/dec
You've probably looked at advance to decline capital before.
You take a basket of stocks, say the s&p100.
For each one you take the net change since yesterday's close, and multiply the net change by the stocks daily volume. This gives you it's capital net change. Then you tally for each negative net change into one group and tally each positive into the other. Then you get the ratio of the positive group to the sum of the positive and absolute of the negative group.
This is a useful number , it's been more telling to me than plain advance decline ratio or adv vol dec vol ratio.
I've taken it a step further however. The adv dec capital is useful but you will get huge skews if stocks have not declined all that much from yesterday's close. This makes it misleading and hard to see when the major mood of the market is changing.
So this is what I prefer.
Take the s&p 100 components and gather the following data for each:
- Variable A: Calculate each components sum of day high and day low /2.
I.E. sum(high,low)/2 - This becomes the mid point of the day for each stocks price action.
- Variable B: Calculate A minus the last price stock traded at. This will give us something similar to net change but in relation to how far the stock is from it's mid point for the day.
- Variable C: Now we multiply, B times the day's volume for the stock. This gives us it's capital change from the mid point.
Now that we have gathered C for each of the s&p 100 components we want to sum the ones that are negative into one group, and the ones that are positive into another. We will call the positive group g1 and neg g2.
Finally we have our handy dandy market mood monitor which is calculated as: g1 / sum(g1,absolute(g2))
If your platform provides a DDE link you can easily get all the realtime quotes for the sp100 components into excel and make this handy indicator for your own benefit. I think it is one of the best ways to gauge the market's mood.
Cheers!
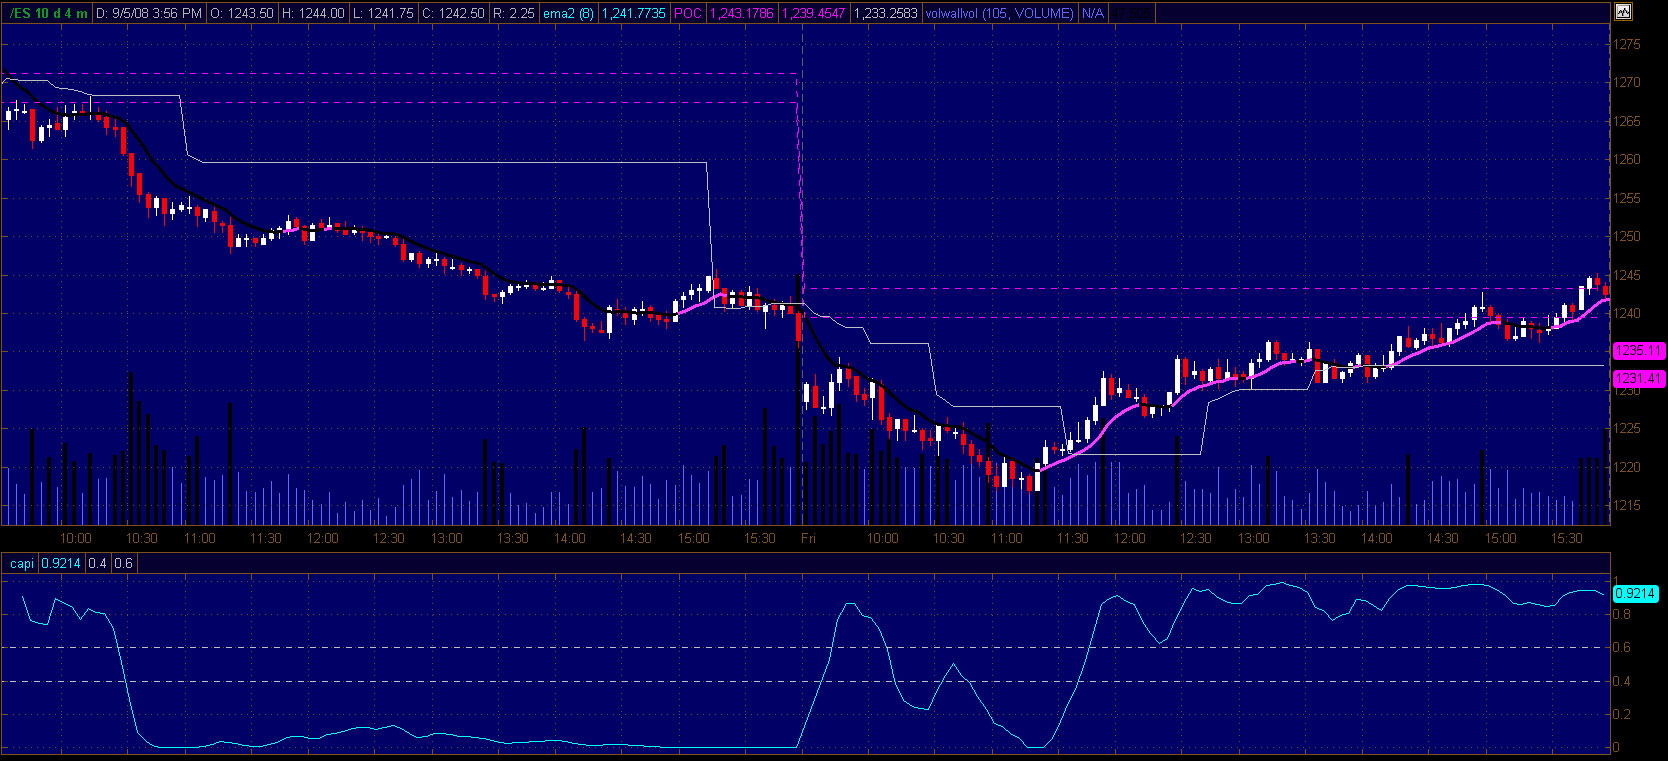
Here is a chart of the same thing I whipped up but with the top 10 of the dow by market cap. This is what it looked like on the last 2 days 4min of ES.
Click image for original size
lots of potential for this POP..thanks for the idea...
Quite welcome, btw the indicator I'm referring to is the one on the bottom pane, just to make it clear.
Emini Day Trading /
Daily Notes /
Forecast /
Economic Events /
Search /
Terms and Conditions /
Disclaimer /
Books /
Online Books /
Site Map /
Contact /
Privacy Policy /
Links /
About /
Day Trading Forum /
Investment Calculators /
Pivot Point Calculator /
Market Profile Generator /
Fibonacci Calculator /
Mailing List /
Advertise Here /
Articles /
Financial Terms /
Brokers /
Software /
Holidays /
Stock Split Calendar /
Mortgage Calculator /
Donate
Copyright © 2004-2023, MyPivots. All rights reserved.
Copyright © 2004-2023, MyPivots. All rights reserved.