Volume I'm using for Friday 12-11
Before I get to todays chart here is the link to the leftover numbers from last Fridays trade etc...
http://www.mypivots.com/forum/topic.asp?TOPIC_ID=3578
http://www.mypivots.com/forum/topic.asp?TOPIC_ID=3578
Coming into today we had the following as posted in last nights thread for the March 09 contract
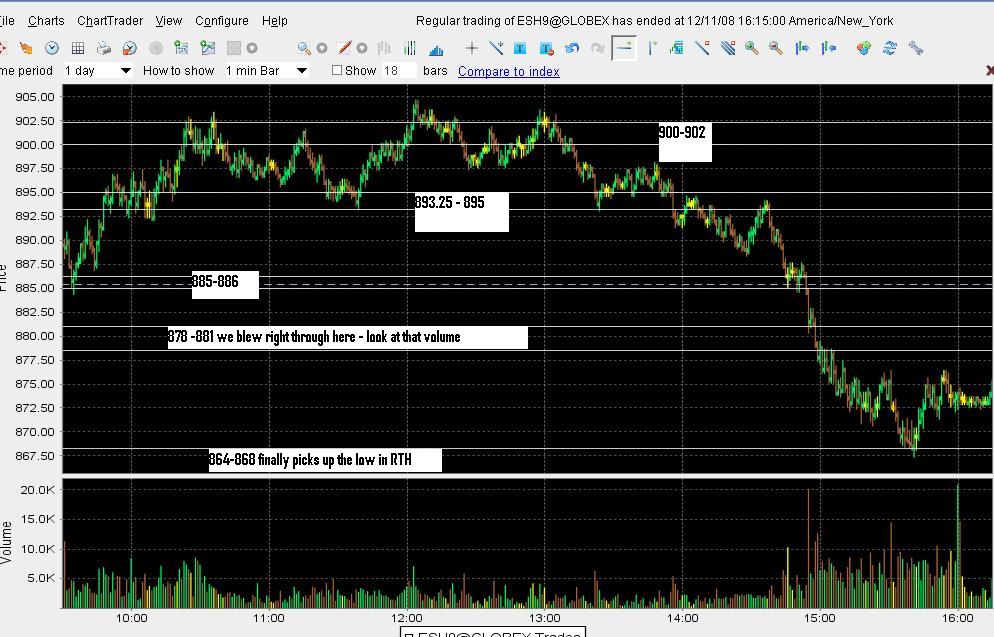
885 - 886
893.25 - 895
900 - 902
These are the leftovers from the December contract
878-881
864 - 868
846 - 849
825 - 827
817 - 820
So on this evenings summary chart I included the 878 - 881 and the 864 - 868 ( part of this zone) because they were still active from December 2008
This chart is fairly sloppy. I was certainly surprised by that volume and how we just ignored that 878 - 881 zone. This becomes the key zone to trade for and get tested. Market profile traders know the singles prints are now in here too...this is the critical magnet!!!
As a side note I donot believe this zones work as well in the overnight it seems that we really need the volume to attract back to volume.
Click image for original size
very well done bruce thanks
Hi, Bruce. I'm just curious how you go about deriving these high volume numbers? Are you using volume at price? Is there another post explaining this and their application in your trading? If so, please refer me to that post.
Thanks
Thanks
Hi Brandon...sorry for the delay...I missed your reply...
I've been babbling about this for probably a year or so but don't know if I put an official thread together.....I'm hoping to start one soon just so I can get the main ideas in one place.
A few quick things for now:
This is not Volume at price although VAP may uncover the same numbers as the day progresses. These Volume prices/zones are formed by thrusts off the one minute chart and may occur in the first 15 minutes of trading or later. They will act as magnets so on some days as the day moves forward price will be attracted to them many times so a VAP study will eventually find them over time. I usually ignore the volume spikes on the opening bar as orders accumulate overnight and can skew them. They are harder to determine in real time and someone new to this would be best off using the ones that formed from the previous session(s) above and below the market. Most would be best to watch for confluence with other methods at these zones.
What would be great is if we could determine if the following is happening when we see a volume thrust:
1)New shorts initated
2)Short covering
3)New longs
4)Long liquidation
You will also find that these spikes will sometimes happen for a "reason". For example on Friday in the ES March we had a spike in the 58 - 60 area ( I'll get actual numbers later so that is from memory). If we go back and see where the S2 level is and the weekly pivot then it makes sense that some big players keyed off that area. I'm not convinced we need to know "why" it happened but it is interesting.
Quite often these spikes will happen at prices that turn out to be the highs and/or lows of the day. Many times they will happen and end up being part of the Value area numbers for that day. This would make sense as the VA is 70% of where the volume based on time happened for that day.
Those mathematically inclined could probably fiqure out where Value should form for that day based on the volume spikes. The real power may possibly be found in the fact that they sometimes form very early in the day. Lots of cool stuff could be derived.
In the simplist form they become nothing more than magnets to be aware of. I look for "ringed" volume on a histogram and it is easy to see the spikes AFTER the day is done. As it unfolds can get tricky.
I hope that helps.
quote:
Originally posted by BrandonLG83
Hi, Bruce. I'm just curious how you go about deriving these high volume numbers? Are you using volume at price? Is there another post explaining this and their application in your trading? If so, please refer me to that post.
Thanks
Here is where I started getting my thoughts down...
http://www.mypivots.com/forum/topic.asp?TOPIC_ID=2685
http://www.mypivots.com/forum/topic.asp?TOPIC_ID=2685
quote:
Originally posted by BrandonLG83
Hi, Bruce. I'm just curious how you go about deriving these high volume numbers? Are you using volume at price? Is there another post explaining this and their application in your trading? If so, please refer me to that post.
Thanks
EXCELLENT BRUCE! your link provided much clarity on your volume zone work...indeed looking for intraday thrusts can be tricky because you wont know until after the fact if it was really a thrust.
Bruce, from fridays action what spikes qualify for one of your zones and which dont?...ive numbered them on the chart
Click image for original size
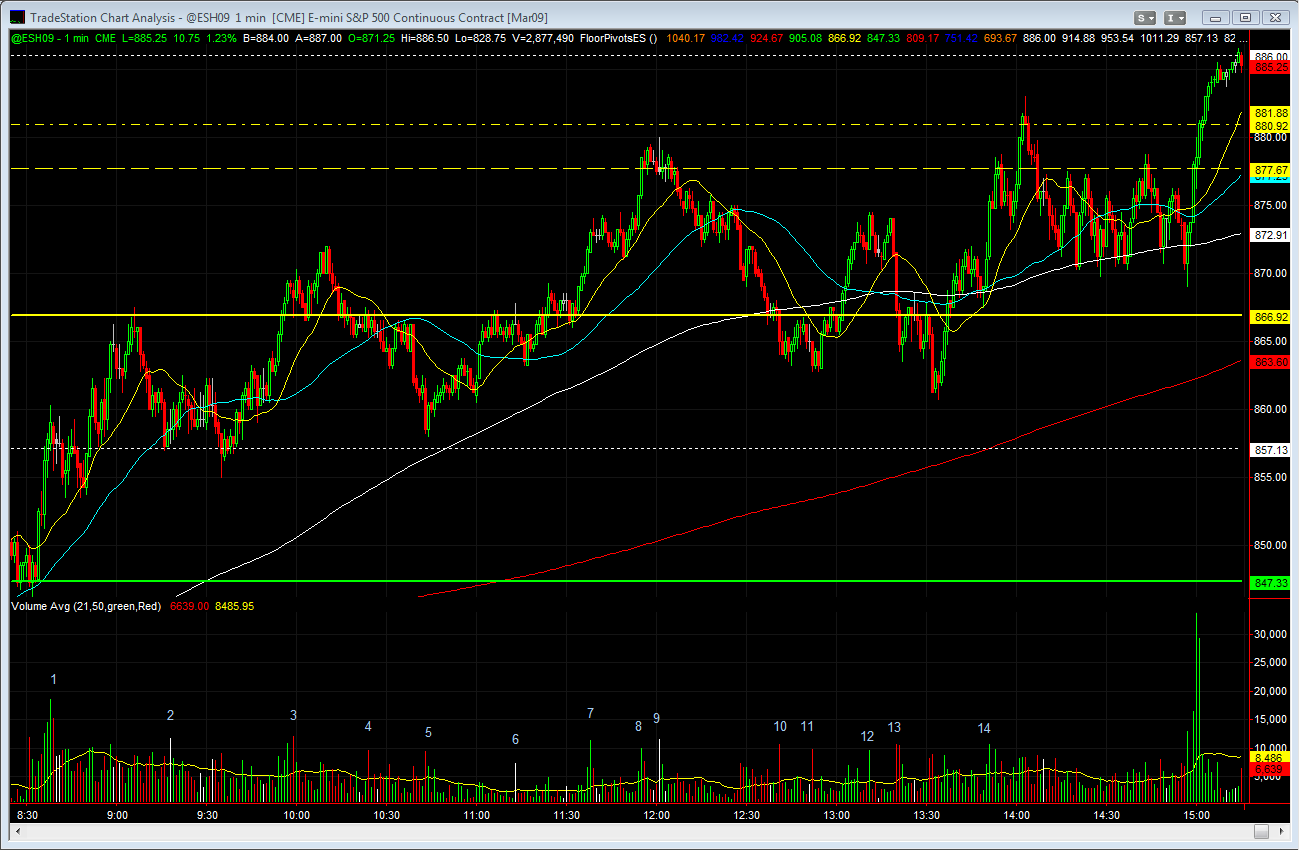
on first glance I have 1, 3, 7 and 9 VO....then I would see what happens on further revisits once I snap the lines... I'll have more time later..that was my quick thoughts looking at your chart..they are the highest and have reactions, consolidations or retraces...
your number 1 is the obvious best because it is the highest and we tested that zone.....I mentioned the 58 -60 in the chat room fairly early
and not because I'm so smart....lol..just because of the volume surge...I forgot about the weekly pivot and learned later that S2
was there.....I'm not sure it matters .....I also think I said in there that one of two things would happen...they would come back
to test it or keep rallying.......I thought it would just keep rallying because it was tested early...I WAS WRONG ...it did both on Friday
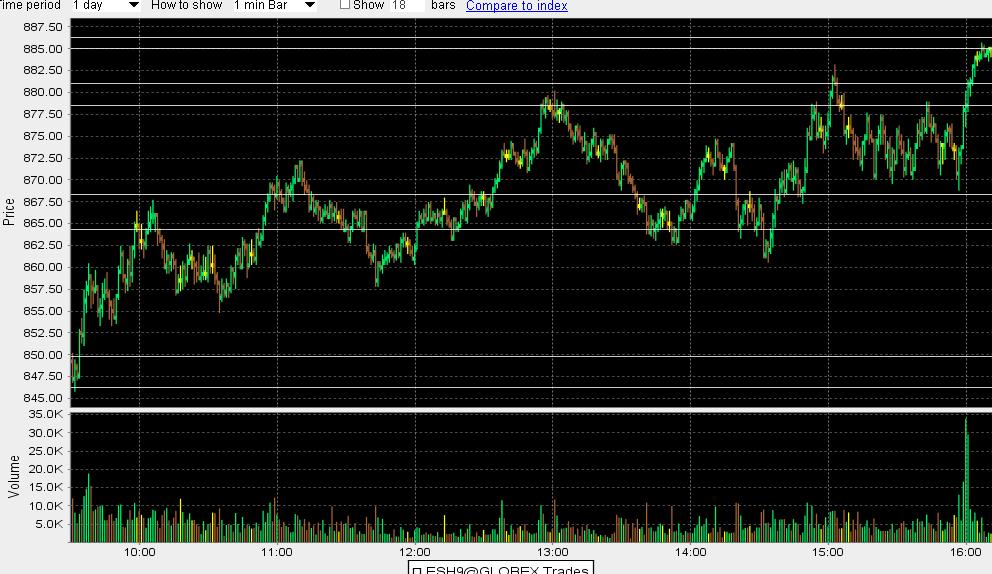
Here is how Friday played out....I'm going to end the SUMMARY charts on this one as it was a cool one and you all have charts anyway. I'm going to post some charts that display the Dynamic Volume in another thread which will show how they develop over time.
One of the most interesting things about Friday was that lower zone. The Weekly Market Profile players know when twice the Monday - Tuesday range is achieved. With a RTH high of 918. 75 and a Tuesday low down around 885 that is 34 points.....so subtracting that from the Tuesday low gives 851.....fairly close to our lower zone. My buddy bought the open based on the Zone and the weekly projection being filled. I wasn't so nimble.
Ok, here is the chart for reference.
Click image for original size
Emini Day Trading /
Daily Notes /
Forecast /
Economic Events /
Search /
Terms and Conditions /
Disclaimer /
Books /
Online Books /
Site Map /
Contact /
Privacy Policy /
Links /
About /
Day Trading Forum /
Investment Calculators /
Pivot Point Calculator /
Market Profile Generator /
Fibonacci Calculator /
Mailing List /
Advertise Here /
Articles /
Financial Terms /
Brokers /
Software /
Holidays /
Stock Split Calendar /
Mortgage Calculator /
Donate
Copyright © 2004-2023, MyPivots. All rights reserved.
Copyright © 2004-2023, MyPivots. All rights reserved.