Dynamic Volume
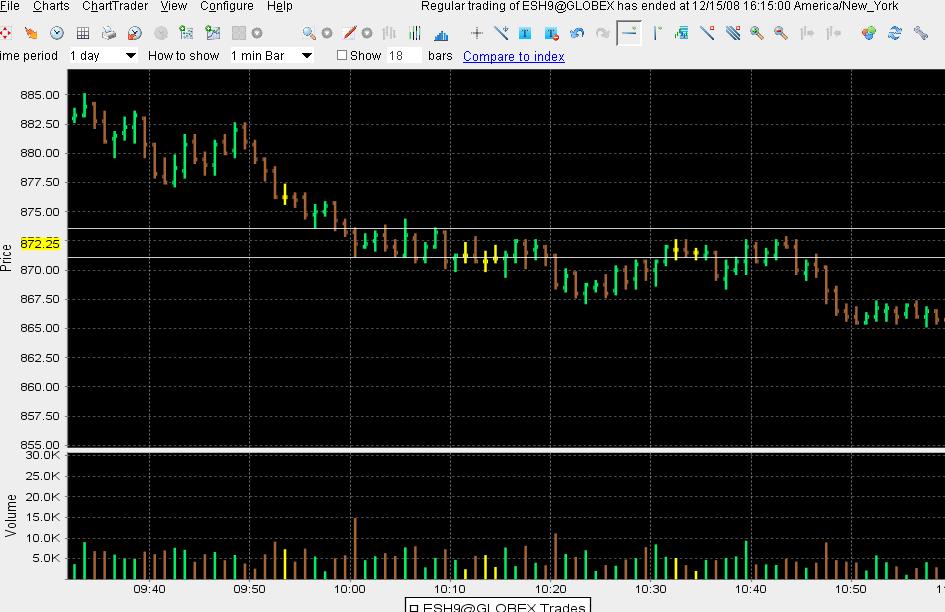
I hope to eventual add much more to this thread. It will pick - up where the Pitbull three thread left off. For now we will look at todays ES chart. I snapped horizontal lines at that volume spike on the one minute time frame at 10:01 eastern time. What made this a better area to snap a line was the extreme low $tick reading...down at minus 1000. Using the $tick is a good filter when looking for volume spikes. I'll add general observations as I can get to them. For now we will just start with the concept of Volume as a Magnet. Here is how my chart looked. I mentioned the 71 - 73 zone in the daytrading thread because it was high volume. No rocket science here! An easy area to spot.
What was so great about this zone is that it created single prints for us MP traders at the same time. Single prints are usually looked at as an area of low volume as the theory states because you don't spend much "time" trading near them and a market moves away from them swiftly.
So we can add a key qualifier to single prints and that is this :
"Single prints are more powerful when there are high volume thrusts along with them"
Just because TIME isn't involved it doesn't mean that volume isn't present.
So at 10:01 a.m we have an area of interest to possibly work from because volume is an attractor of price.
These volume areas will generally end up being part of the Value areas and /or form near the high or lows of the day. The Value area high as posted on the forum is 873.75 and we had a 71 - 73 zone at 10:01 this morning. No coincidence!
ON trending days you will see volume being accepted at higher/ lower levels without retests......very hard to spot sometimes.
Something I'm working on: If a high volume zone forms it can end up being in the center of the days trading and form a fairly Balanced day. Meaning there is equal trade on both sides of the volume. We can project a high or a low from these volume areas....
Todays RTH (885.25) high to the 71 - 73 zone is 12 points ...so we can subtract 12 points from the low of the zone to get a possible lower target. Think about it.....the high volume is a magnet and as long as new higher volume doesn't enter the market we can expect the day to be fairly balanced with prices centered around the middle.....of course new volume could have entered on the lows but it didn't.
So if we subtract 12 points from the lower end of the zone we get a target of 859...and we had a zone at 58 - 60... created in Fridays trading. Like I said , this is still a work in progress.
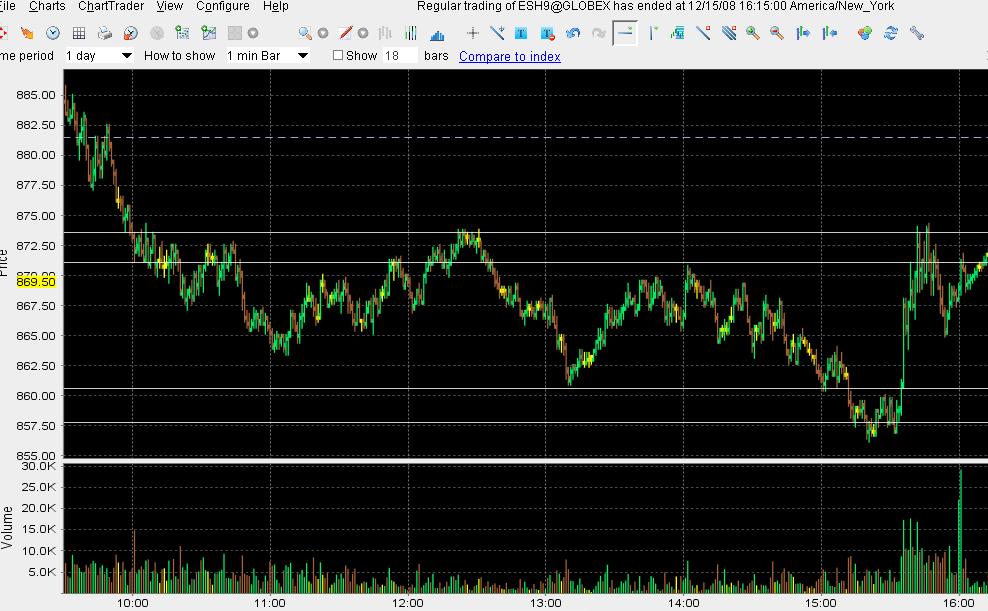
Here is how the overall day ended.
For Tuesday I'm using that great 71 - 73 zone and still the 58 - 60...we had the leftover 85 area which capped todays high and capped Fridays late day rally so that is an obvious area. Volume at it's finest. I have to make this more coherent when I can but it's a start
Bruce
Click image for original size
What was so great about this zone is that it created single prints for us MP traders at the same time. Single prints are usually looked at as an area of low volume as the theory states because you don't spend much "time" trading near them and a market moves away from them swiftly.
So we can add a key qualifier to single prints and that is this :
"Single prints are more powerful when there are high volume thrusts along with them"
Just because TIME isn't involved it doesn't mean that volume isn't present.
So at 10:01 a.m we have an area of interest to possibly work from because volume is an attractor of price.
These volume areas will generally end up being part of the Value areas and /or form near the high or lows of the day. The Value area high as posted on the forum is 873.75 and we had a 71 - 73 zone at 10:01 this morning. No coincidence!
ON trending days you will see volume being accepted at higher/ lower levels without retests......very hard to spot sometimes.
Something I'm working on: If a high volume zone forms it can end up being in the center of the days trading and form a fairly Balanced day. Meaning there is equal trade on both sides of the volume. We can project a high or a low from these volume areas....
Todays RTH (885.25) high to the 71 - 73 zone is 12 points ...so we can subtract 12 points from the low of the zone to get a possible lower target. Think about it.....the high volume is a magnet and as long as new higher volume doesn't enter the market we can expect the day to be fairly balanced with prices centered around the middle.....of course new volume could have entered on the lows but it didn't.
So if we subtract 12 points from the lower end of the zone we get a target of 859...and we had a zone at 58 - 60... created in Fridays trading. Like I said , this is still a work in progress.
Here is how the overall day ended.
Click image for original size
For Tuesday I'm using that great 71 - 73 zone and still the 58 - 60...we had the leftover 85 area which capped todays high and capped Fridays late day rally so that is an obvious area. Volume at it's finest. I have to make this more coherent when I can but it's a start
Bruce
Here is another piece to this puzzle, roughly lets say the high of the bar in the first chart is 873 with the low as 871. Now using KB's technique do the price projection on this bar and you would get a result of 867.75.So a long there would indeed yeild results. Now someone could add a cycle to it then we have an excellent way of looking at the market.
Great stuff AK1...thanks for that!!
quote:
Originally posted by ak1
Here is another piece to this puzzle, roughly lets say the high of the bar in the first chart is 873 with the low as 871. Now using KB's technique do the price projection on this bar and you would get a result of 867.75.So a long there would indeed yeild results. Now someone could add a cycle to it then we have an excellent way of looking at the market.
Good explaination of your method.
Do you have a minimum volume threshold you look for to help identify a potential volume spike ?
Do you have a minimum volume threshold you look for to help identify a potential volume spike ?
Well 10K is a good level for RTH
The highest Volume bar from the fed day today fell at 891.25 - 898....
the low today came in at 875.75 which was 15.5 points under the high volume bars low..........so if we add that same 15.5 points to the high of the volume bar at 898 we end up at 913.50...todays RTH high came in at 915 according to my data....perhaps I will rename this thread "fun with numbers". I'll be following this concept as we go forward. hope all did well today.
Bruce
quote:
Originally posted by BruceM
Something I'm working on: If a high volume zone forms it can end up being in the center of the days trading and form a fairly Balanced day. Meaning there is equal trade on both sides of the volume. We can project a high or a low from these volume areas....
Emini Day Trading /
Daily Notes /
Forecast /
Economic Events /
Search /
Terms and Conditions /
Disclaimer /
Books /
Online Books /
Site Map /
Contact /
Privacy Policy /
Links /
About /
Day Trading Forum /
Investment Calculators /
Pivot Point Calculator /
Market Profile Generator /
Fibonacci Calculator /
Mailing List /
Advertise Here /
Articles /
Financial Terms /
Brokers /
Software /
Holidays /
Stock Split Calendar /
Mortgage Calculator /
Donate
Copyright © 2004-2023, MyPivots. All rights reserved.
Copyright © 2004-2023, MyPivots. All rights reserved.