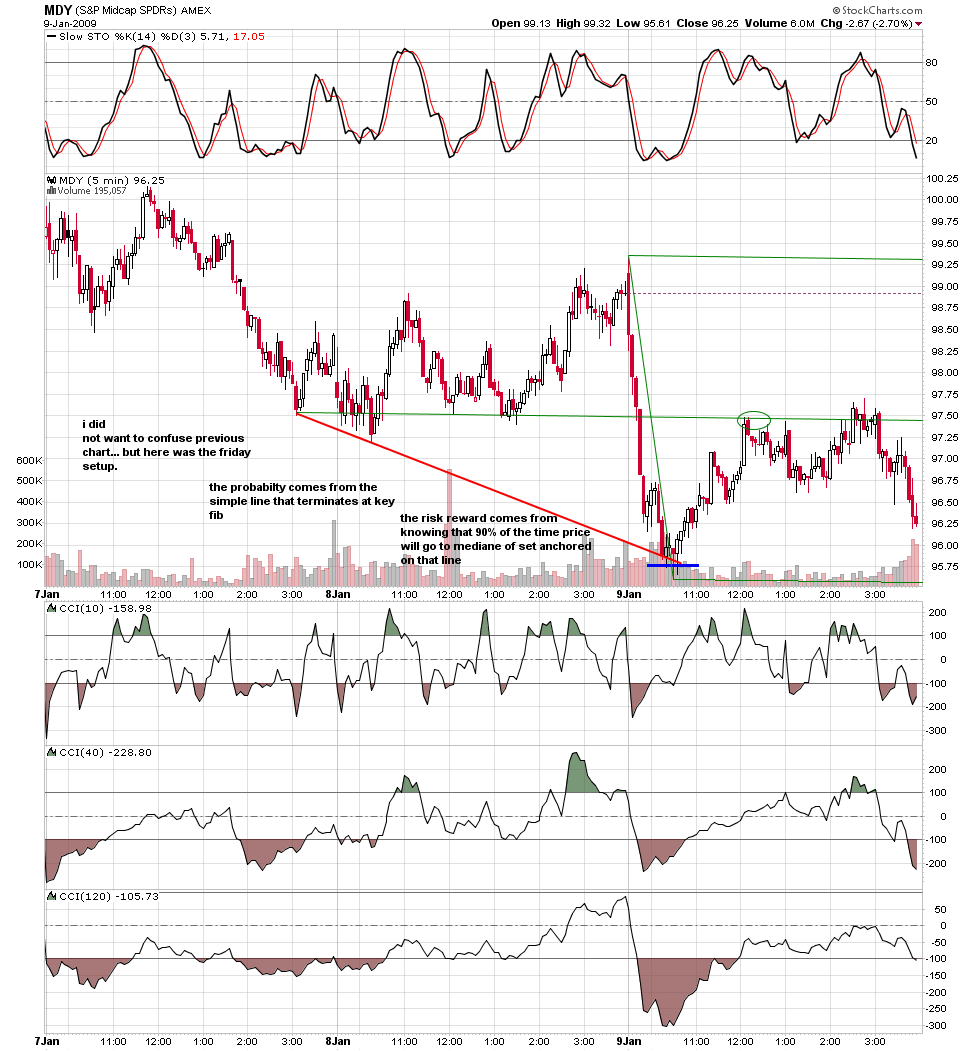
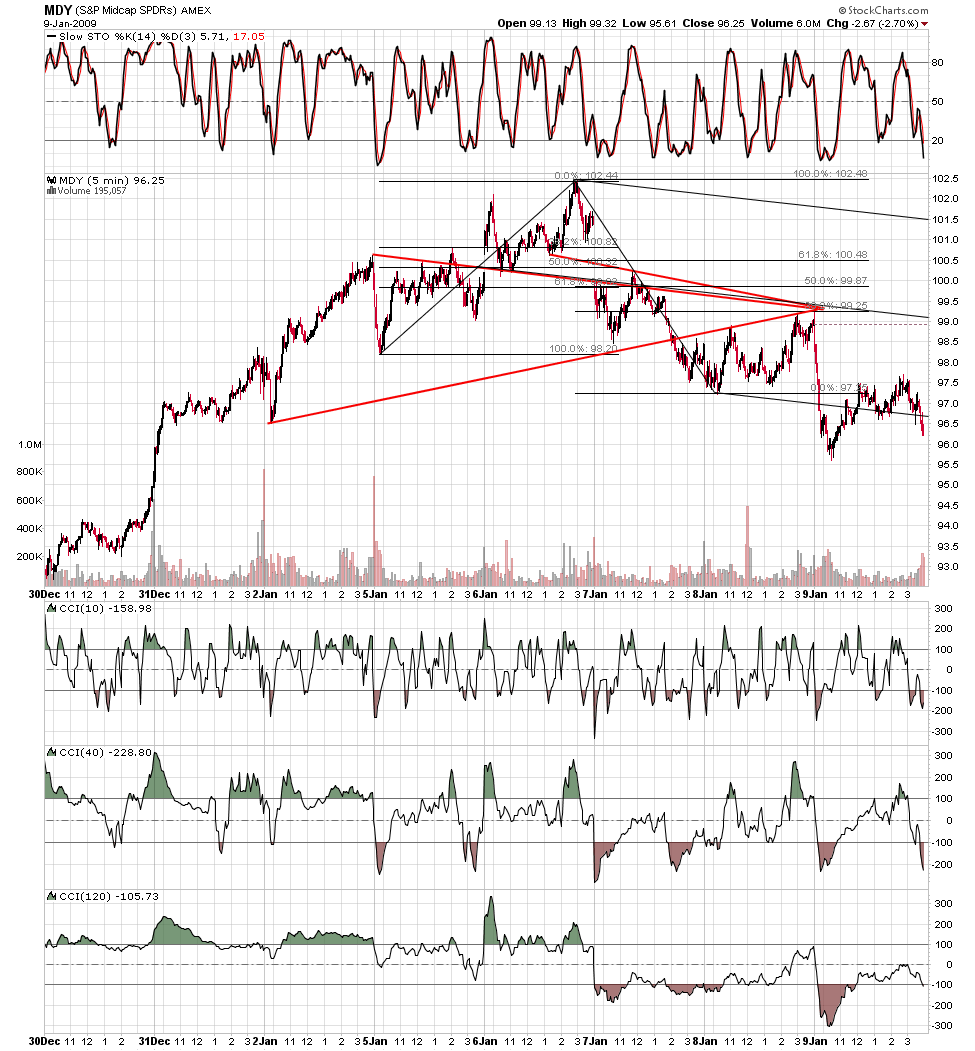
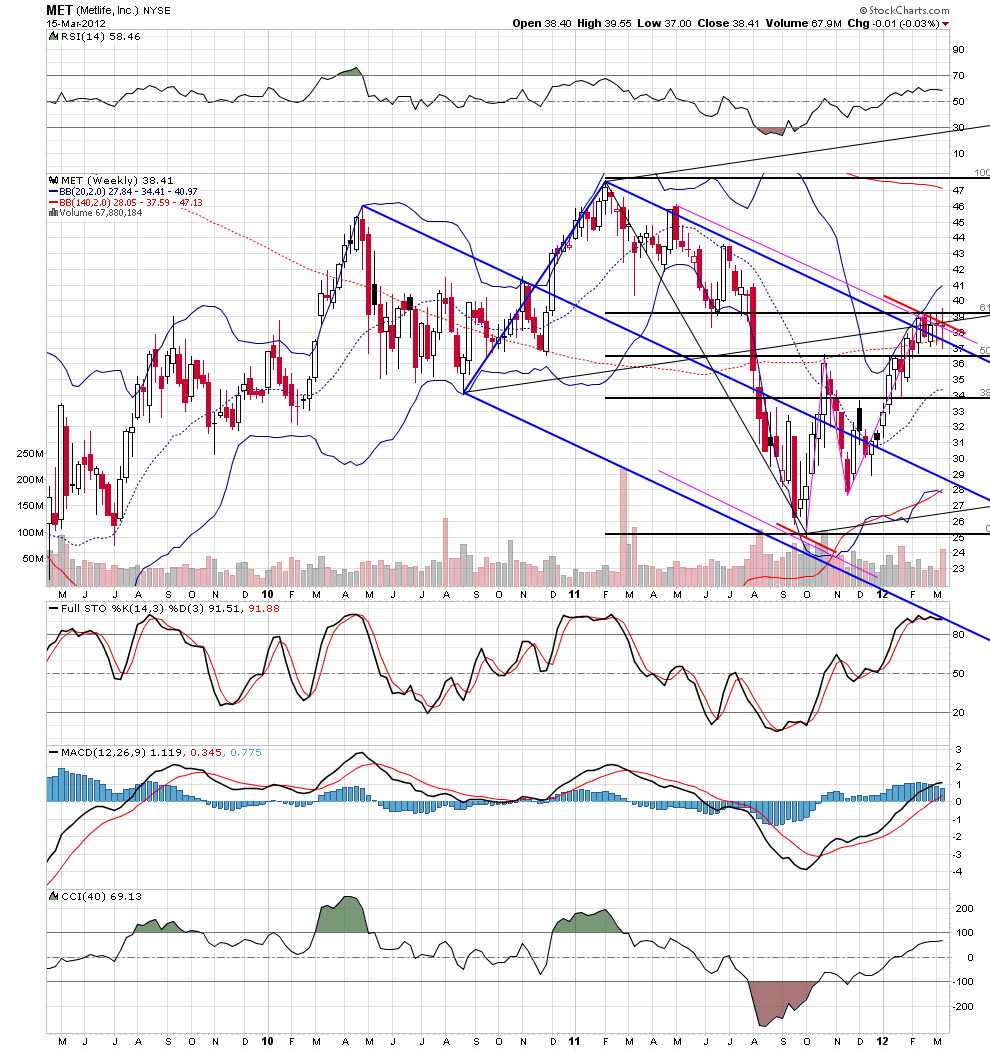
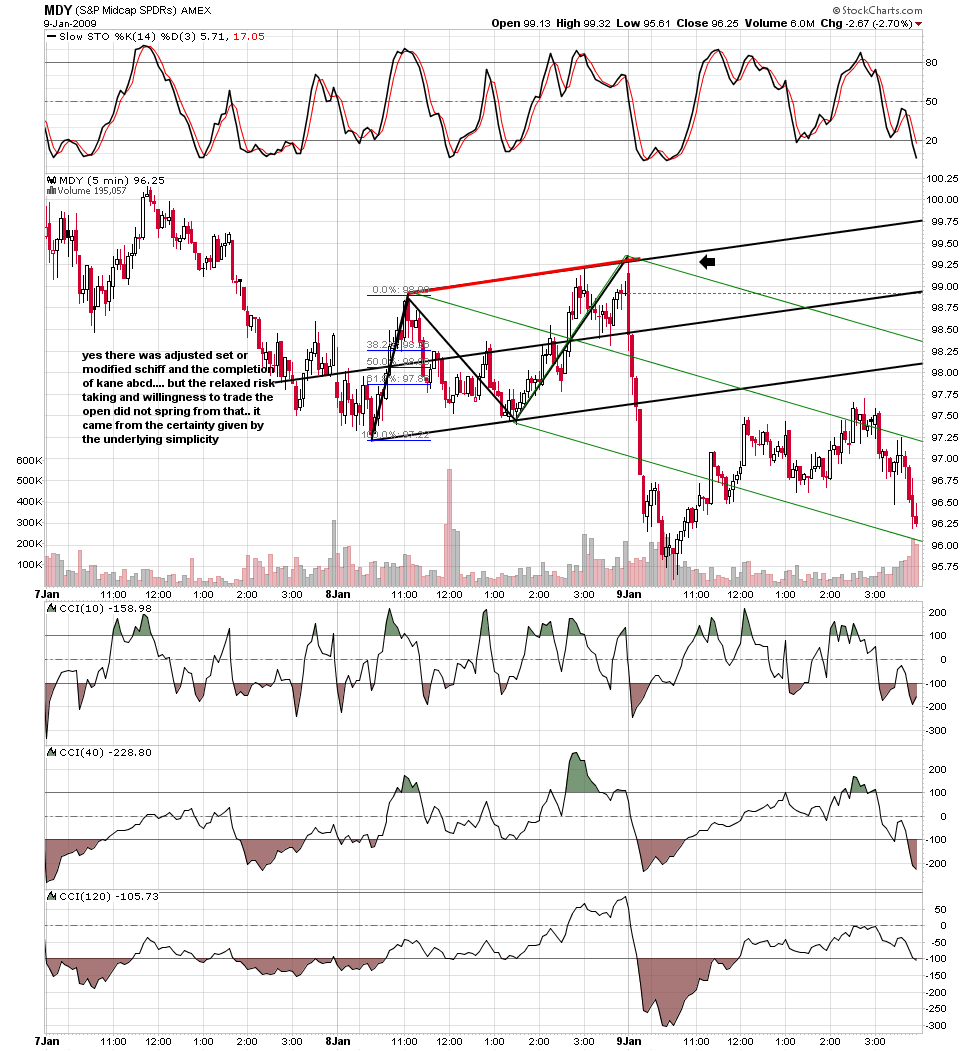
i know that these charts can be recreated and shown differently with all the wonderful tools and theories we have learned... but i was after something else.. a unified trade setup that is based on the simplicity underlying all that complexity that had a certainty given by no other setup... for me, this is it.
MR
mreiserer
Rep: 110
Posts: 2,220
Beautiful!
I am currently reading a book about a contemporary star-chef for whom the author of the book has worked as his "kitchen-slave". One of the most memorable thoughts from the book:
In normal life, simplicity is synonymous with easy-to-do, but when a chef uses the word it means "take a lifetime to learn".
So even though what you are showing here looks dead simple and is not hard to follow, I can only begin to grasp the many, many years of experience that this has emerged from.
RO
roofer
Rep: 3,689
Posts: 3,574
m-thank you for the insight... it goes right to the heart of the matter.we can soup it up, add the dualsod quad pods with racing stripe trim, but in the end all we need is basic transport to get from a to b.this is basic transport. we will all know it is successful if we all make what we need to the point where jim closes the site because everyone has moved on.including me including jim.
JI
jimkane
Rep: 3,058
Posts: 33,089
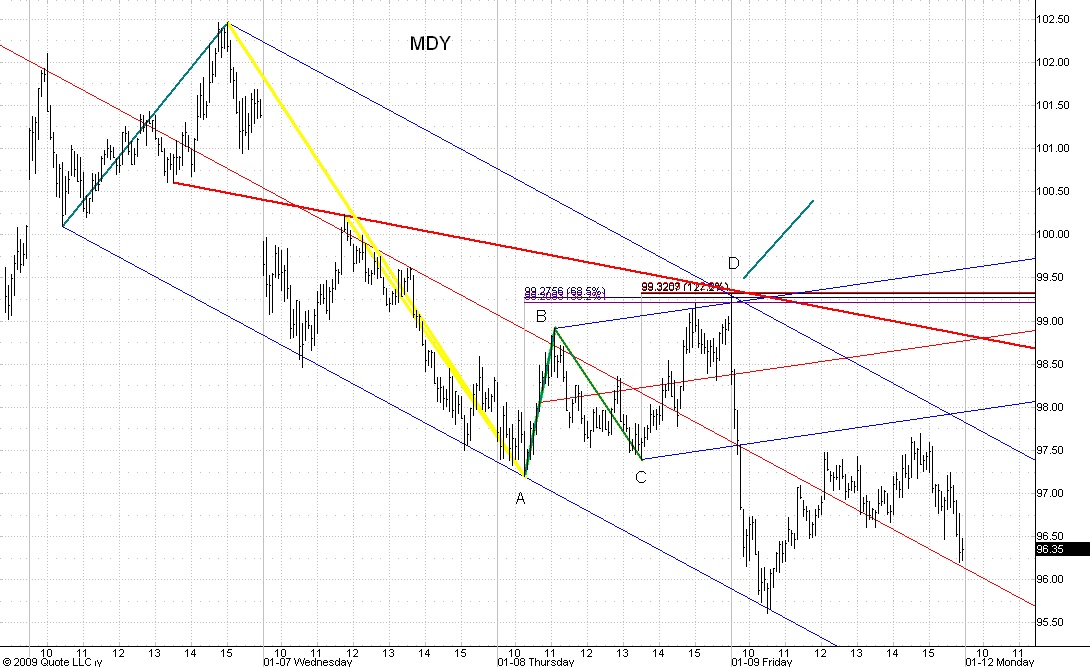
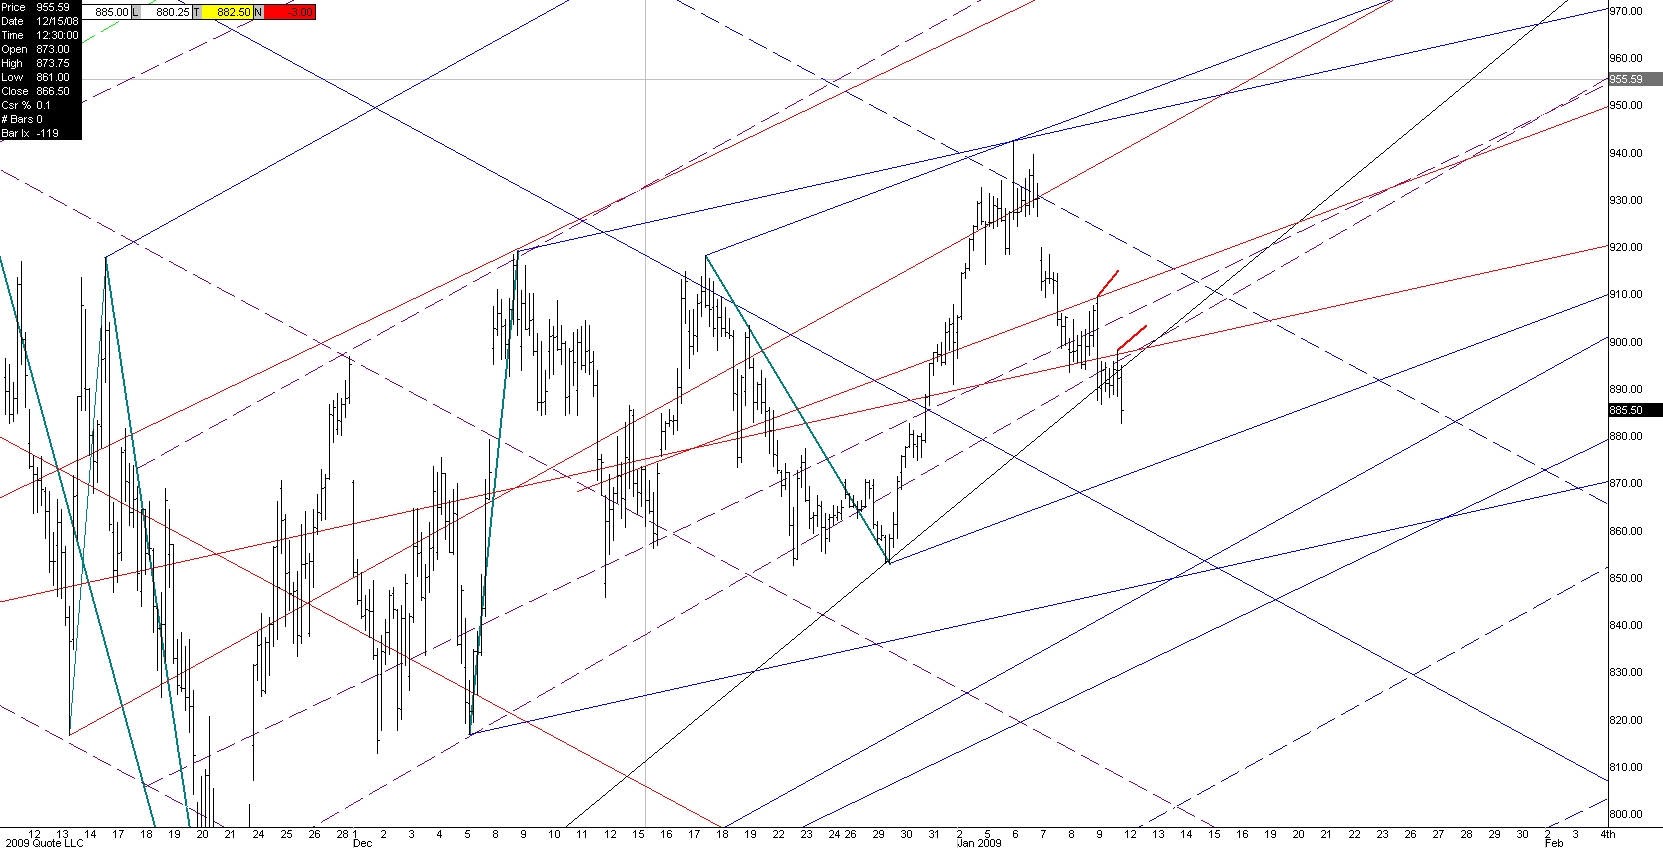
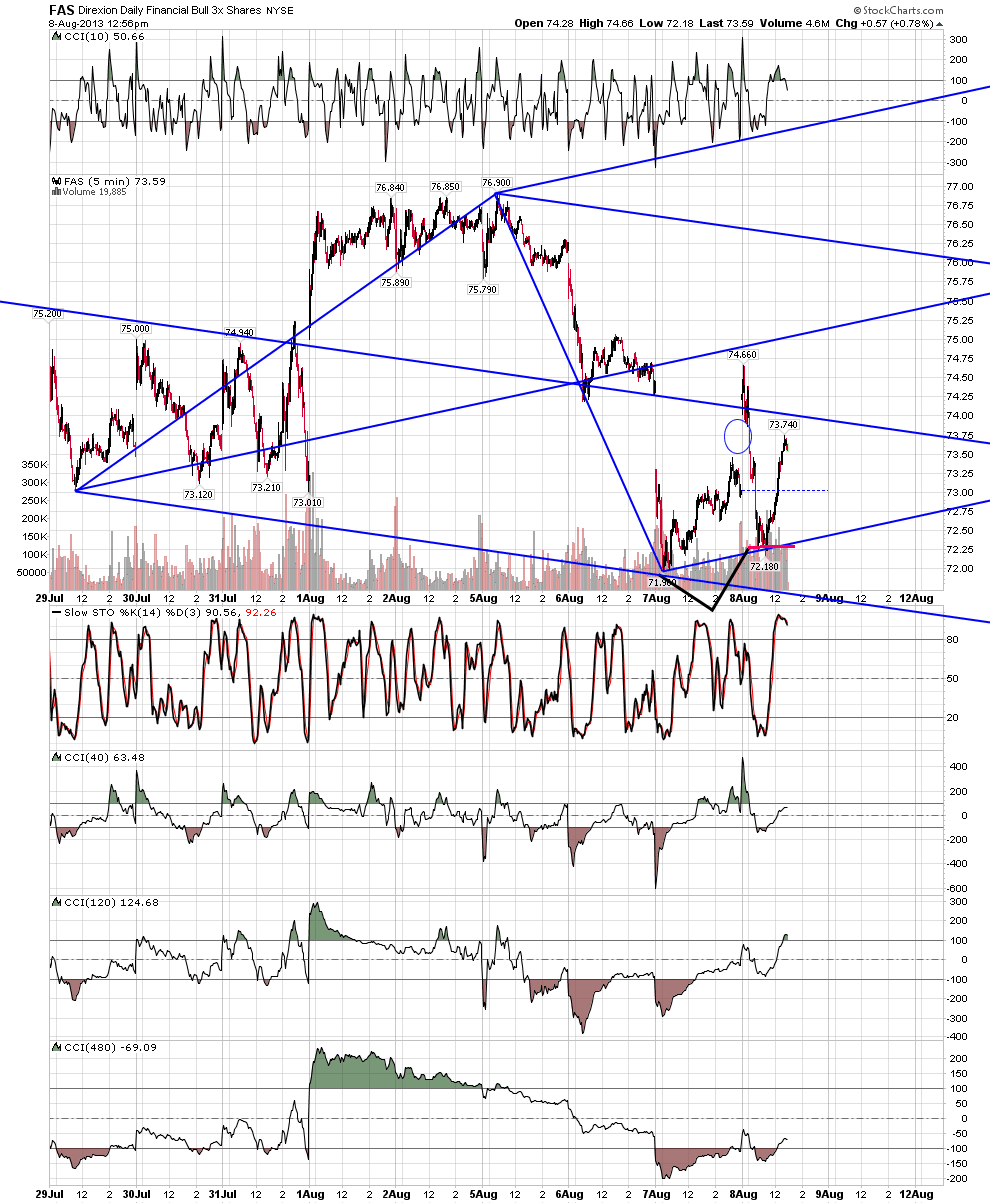
I don't want to get off the direction of this wonderful thread here, but I did want to show why I was fully commited to selling the open on Friday based on my work. It's amazing how various tools will point to the same exact spot. Those who have worked one-on-one with me know why I put everything on here (and especially why I chose the specific 'adjusted' set that I did), as it is straight out of the books and what I show in the sessions.
A few things to note. Notice how many times the price action used that lower // of the 'adjusted' set. It also terminated the morning's selloff, off the ABCD, right back at that line. Those that have worked for awhile one-on-one with me should see two signature moves that also pointed to that lower // as the end of the move. I have the modified Schiff on the ABCD on there, right out of the books, and the key and obvious Fibs, .382 of the entire move down, .685 off a key swing, 1.128 ABCD price projection, and 1.272 BC external retracement. I also put a basic 'alternating pivot' line (one swing high, one swing low, in either order) on there that I go into detail on in the one-on-one sessions.
I left off another alternating pivot line that was really cool, because it overlapped roofer's spike line, and the modified Schiff upper //, and I wanted to only show the KT work on this chart. You should look at it, though, because it is awesome, and I had it on my working charts. Start at the swing low from the morning of the 7th and go to the B point of the ABCD. It should track right along that upper //. That cinched it for me. As an aside, the B point was a .564 off the same pivot used for that .685, to the penny by my data.
As I said, I don't want to get off topic here in this thread, but as soon as I saw roofer's MDY chart, and his mention about the KT factors that were there, I wanted to show what the KT methodology showed, too. I could have started a new thread for this, but I thought it would be more beneficial for people to be able to see the work side by side, too. I find it endlessly amazing how completely different work can point to the same exact spot.
Chart created by QCharts, courtesy eSignal.
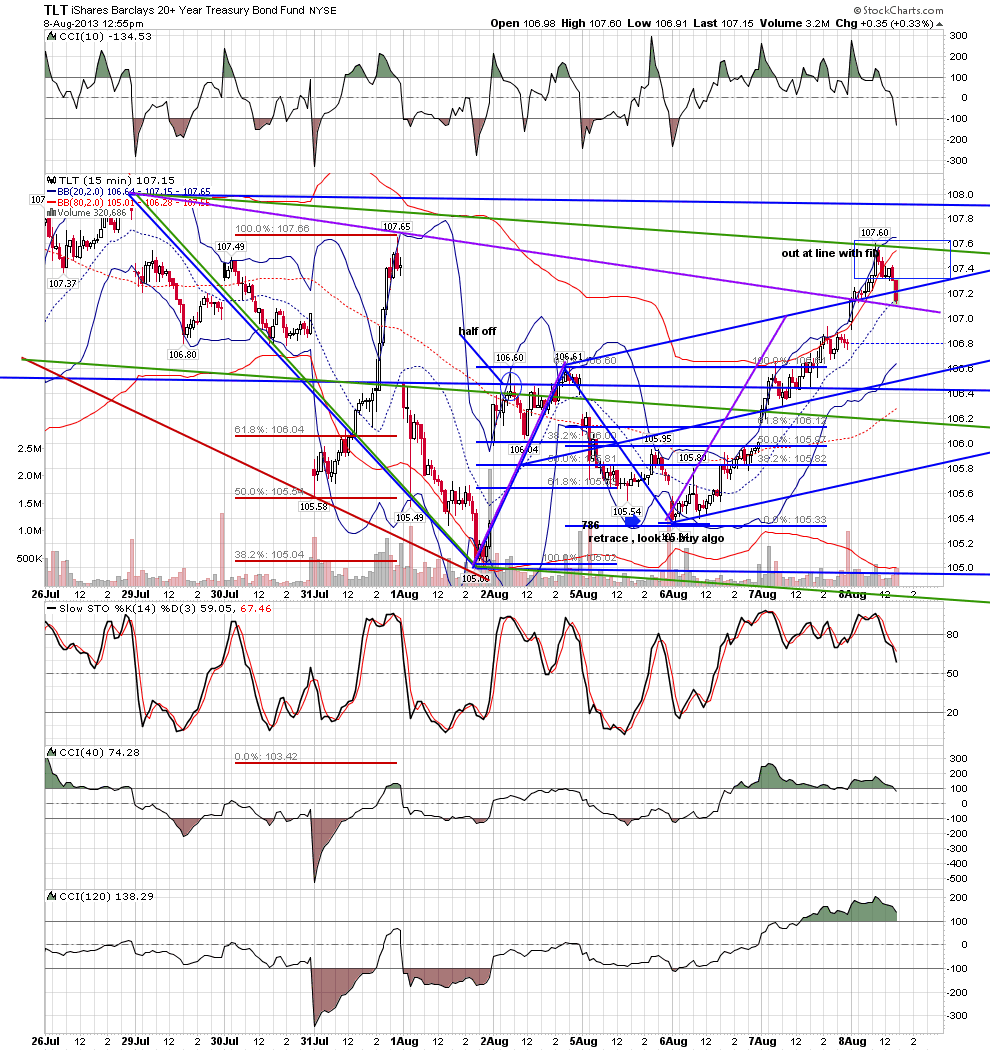
A few things to note. Notice how many times the price action used that lower // of the 'adjusted' set. It also terminated the morning's selloff, off the ABCD, right back at that line. Those that have worked for awhile one-on-one with me should see two signature moves that also pointed to that lower // as the end of the move. I have the modified Schiff on the ABCD on there, right out of the books, and the key and obvious Fibs, .382 of the entire move down, .685 off a key swing, 1.128 ABCD price projection, and 1.272 BC external retracement. I also put a basic 'alternating pivot' line (one swing high, one swing low, in either order) on there that I go into detail on in the one-on-one sessions.
I left off another alternating pivot line that was really cool, because it overlapped roofer's spike line, and the modified Schiff upper //, and I wanted to only show the KT work on this chart. You should look at it, though, because it is awesome, and I had it on my working charts. Start at the swing low from the morning of the 7th and go to the B point of the ABCD. It should track right along that upper //. That cinched it for me. As an aside, the B point was a .564 off the same pivot used for that .685, to the penny by my data.
As I said, I don't want to get off topic here in this thread, but as soon as I saw roofer's MDY chart, and his mention about the KT factors that were there, I wanted to show what the KT methodology showed, too. I could have started a new thread for this, but I thought it would be more beneficial for people to be able to see the work side by side, too. I find it endlessly amazing how completely different work can point to the same exact spot.
Chart created by QCharts, courtesy eSignal.
MR
mreiserer
Rep: 110
Posts: 2,220
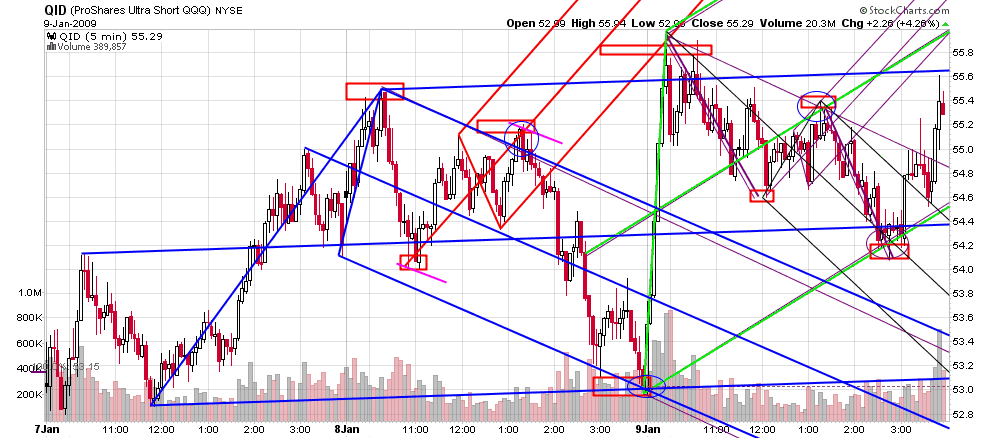
Yes it was a classic and the ES also gave a nice setup/trigger in pre-market.
RO
roofer
Rep: 3,689
Posts: 3,574
again i am after relaxed certainty not theory.. and i am showing the only setup i know that gives me that with a very tight stop...if you want absolute simplicity ... draw simple line.. trade time exactly as i have explained...vertical red lines are where geometry and time come together.but that is not my point.the unifying pricipal of simple line fib and medianline set gives us a target that is reached 90% of time and AUTOMATICALLY gives us a very tight stop for the small percentage when it is wrong... based on a 1/5th measure to target...i trade no other setup with this relaxed certainty...
MR
mreiserer
Rep: 110
Posts: 2,220
Another cool thing that augmented the two short setups for the ES Friday was the fact that each one tested an ML of separate adjusted sets from below. I realize more and more that the real good setups have stuff come together seemingly out of the blue. I guess that's why they call it harmonic. To sort out the real good setups from the rest, the ones that are worth playing, is one of the real tough learning curves imo.
What's curious to me here is the quasi three drives pattern at EOD that reacted at ML of a standard set (not shown)...
RO
roofer
Rep: 3,689
Posts: 3,574
is everyone up to speed with the basic concept? has anyone figured out the two rules for target setting?
AL
albert
Rep: 99
Posts: 3,094
Here is my "wordy" answer.
The simple line method you described is fantastic.
I understand the price target is the Median Line for a ML set drawn based on the Simple Line as you have described in this Kane forum here.
So:
Target 1 = ML Line
& Target 2 = Opposite ML //, depending on Price behavior at ML Line.
Thanks for this fantastic method.
Al Kamego