

AK
ak1
Rep: 858
Posts: 740
KB, AS PER THE PRICE PROJECTION THEORY, 844-833.25=10.75*1.618=17.39. 833.25-17.39=815.86. HOW IT YOU GET 808.50????

GI
gio5959
Rep: 200
Posts: 444
[quote]Originally posted by JackS65
jacks65
how often do you post those 5min es charts
so i can plan on stopping by and taking a look
tia
gio
jacks65
how often do you post those 5min es charts
so i can plan on stopping by and taking a look
tia
gio
TO
toaksie
Rep: 30
Posts: 4
quote:
Originally posted by koolblue
Click image for original size...
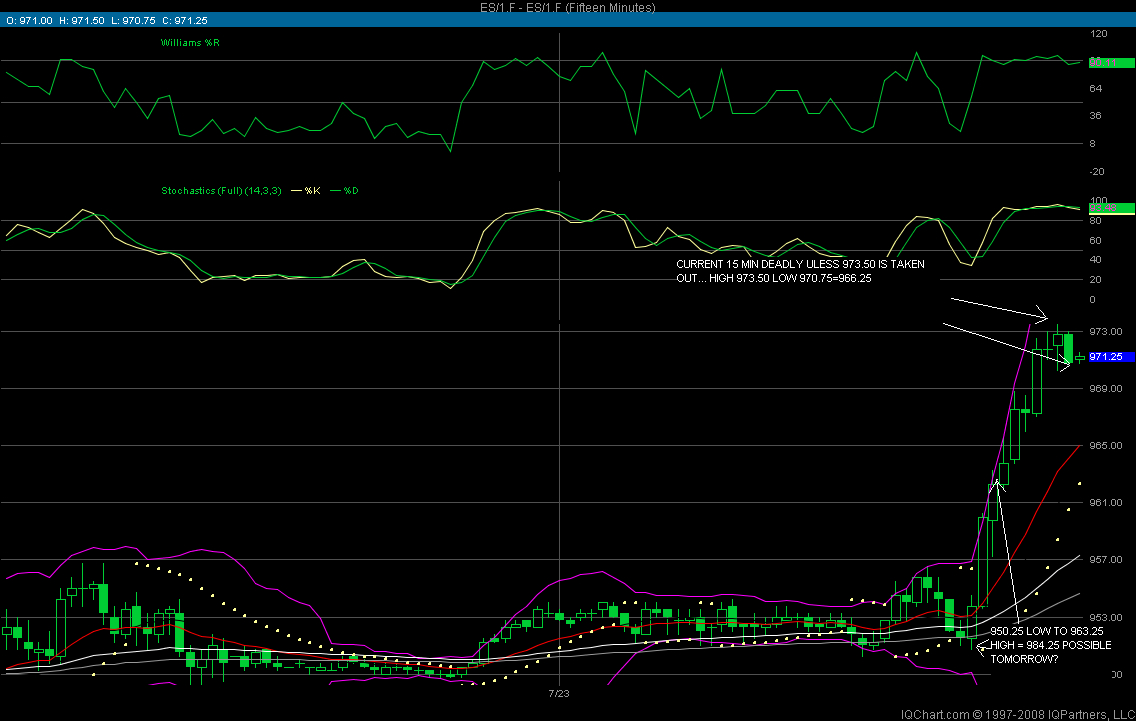
I´m very interested in your strategy for predicting these lows and highs, could explain the process to me as i am a newbie and not sure where your referencing your calculations from,
thanks for your time,
Update: Scrap this just read your excellent explanation under the Kool´s tools section. I do have another question though, in one of the charts above you state that you take the 840 price from what appears to be the signal line. If this is correct what does that signal line indicate or how is it set up, thanks again for your time and also for the excellent explanations you have already provided.