Charts 2-26-09
Click image for original size
...
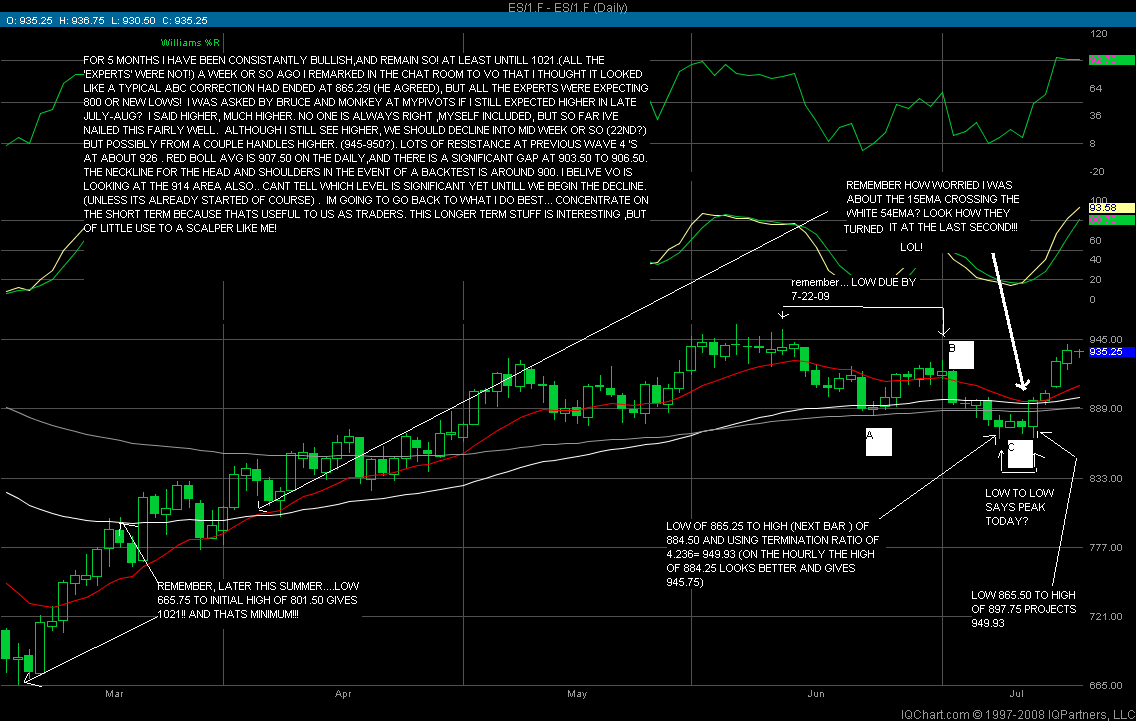
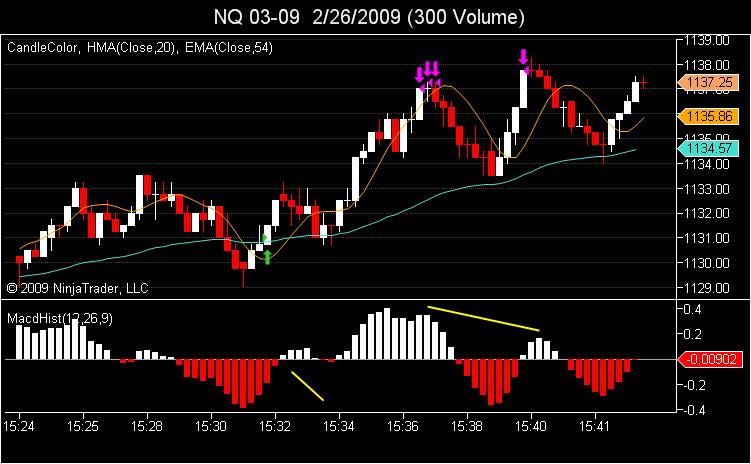
Ill likely post more charts this weekend as time allows, but to reiterate what the charts are saying , we have made a short term bottom likely to be short in duration. some numbers to watch on the downside are the 733 area and the 716-18 area. On the upside youve heard me talk about the mid 780's resistance area.thereis also strong resistance at 795.50 and around the 812-16 area. Anyone of these could cap the rally. were not likely to see 950-1150....yet!! but its coming,just not yet IMHO.remember the strong cycle low coming in late March! And remember closing ticks are hinting the rally should end this week! if we get another high ticks reading the top could be postponed into next week, but so far thats the way it looks to me.
The purpose of these charts is not to showTHE top but to show how i decide on possible trading areas! Right or wrong it sure appears this 781 area might be good for a short scalp!!! ...time will tell!!!
On the chart labeled 7:34:29, I do not understand the numbers on the far right. There is no candle with a high of 776.25; I do not see that number.
quote:
Originally posted by smithgar
On the chart labeled 7:34:29, I do not understand the numbers on the far right. There is no candle with a high of 776.25; I do not see that number.
It was a typo. He meant to type 766.25 as the high. If you do the calculation you will see that number gives you the high projection KB gave.
thx PREST!
Click image for original size
Click image for original size
Click image for original size

Click image for original size
Emini Day Trading /
Daily Notes /
Forecast /
Economic Events /
Search /
Terms and Conditions /
Disclaimer /
Books /
Online Books /
Site Map /
Contact /
Privacy Policy /
Links /
About /
Day Trading Forum /
Investment Calculators /
Pivot Point Calculator /
Market Profile Generator /
Fibonacci Calculator /
Mailing List /
Advertise Here /
Articles /
Financial Terms /
Brokers /
Software /
Holidays /
Stock Split Calendar /
Mortgage Calculator /
Donate
Copyright © 2004-2023, MyPivots. All rights reserved.
Copyright © 2004-2023, MyPivots. All rights reserved.