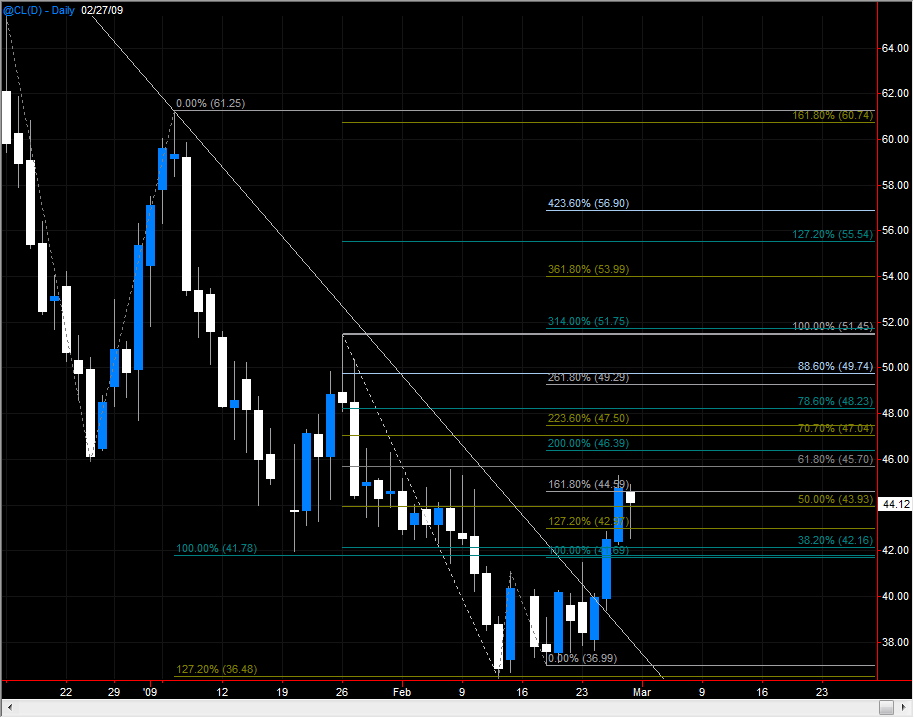
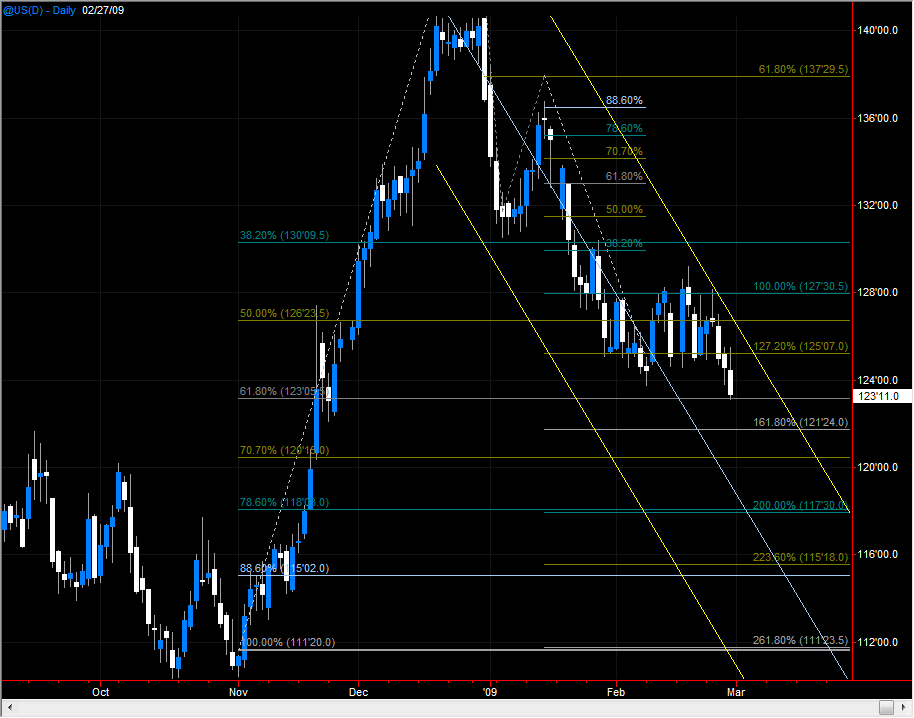
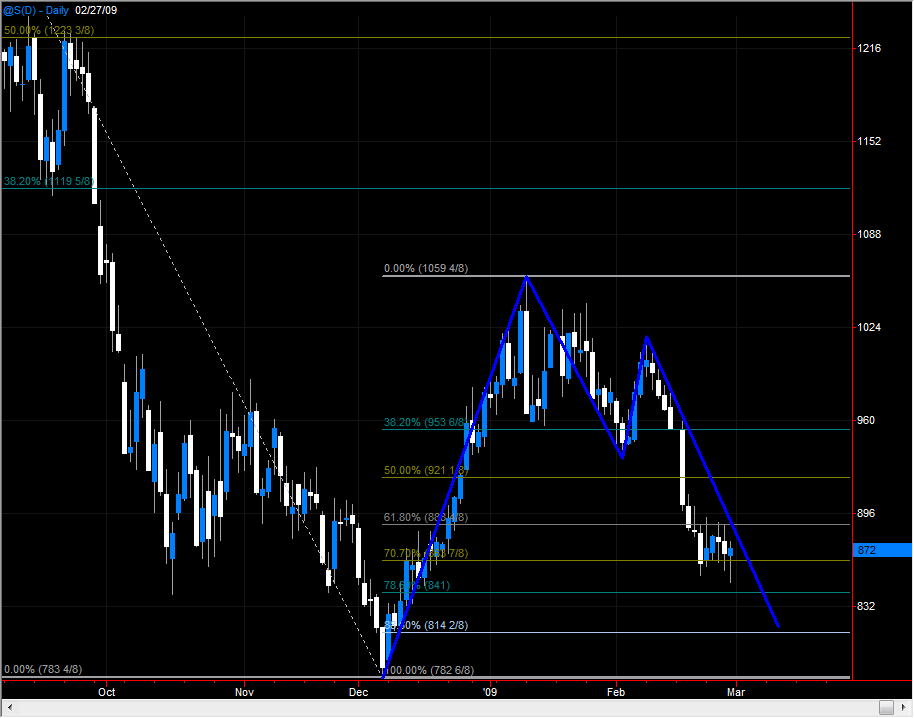
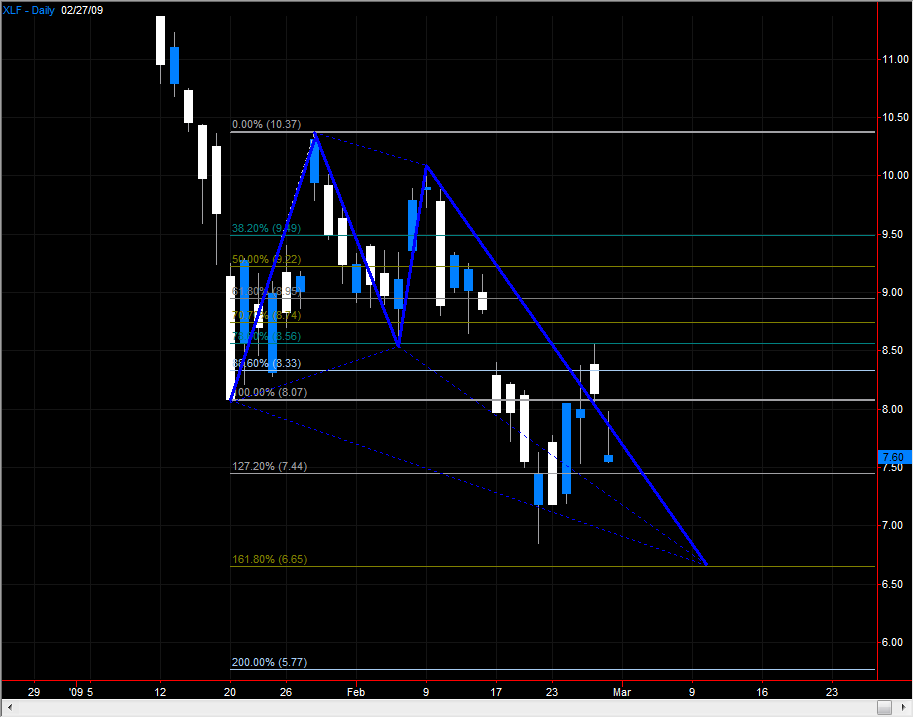
Weekend Chart Summary 2-28-09
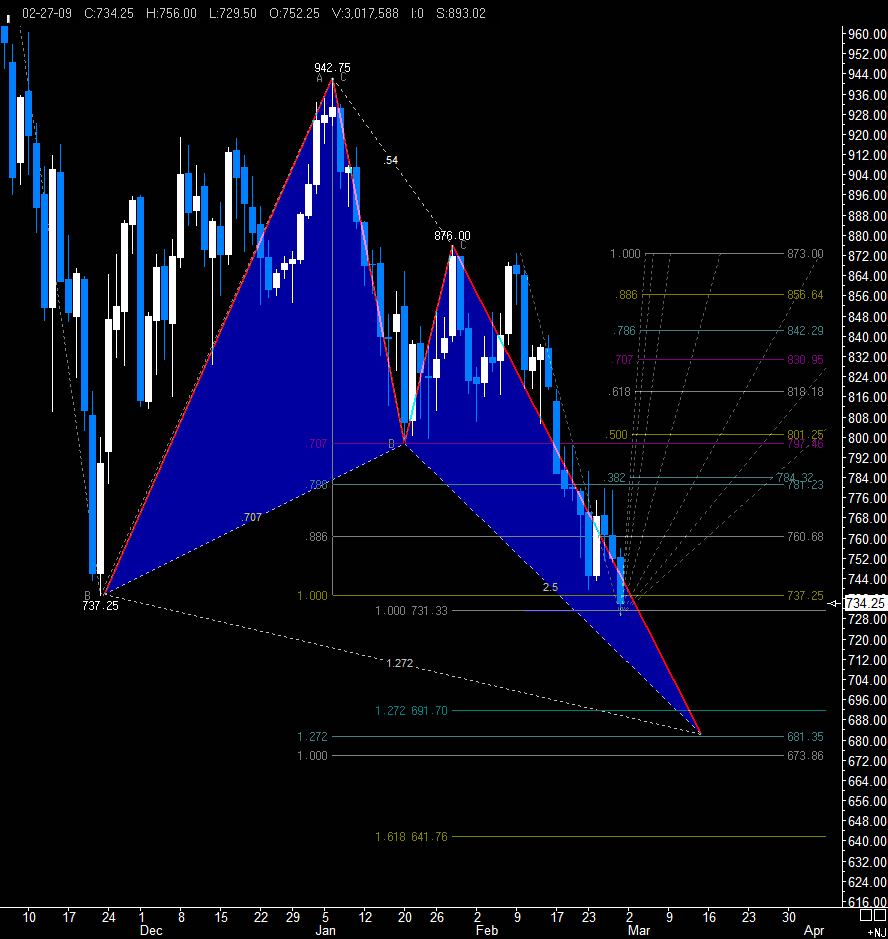
On a very short term basis ,(globex?) there is also good resistance around the 744-745 pivots and moving averages.
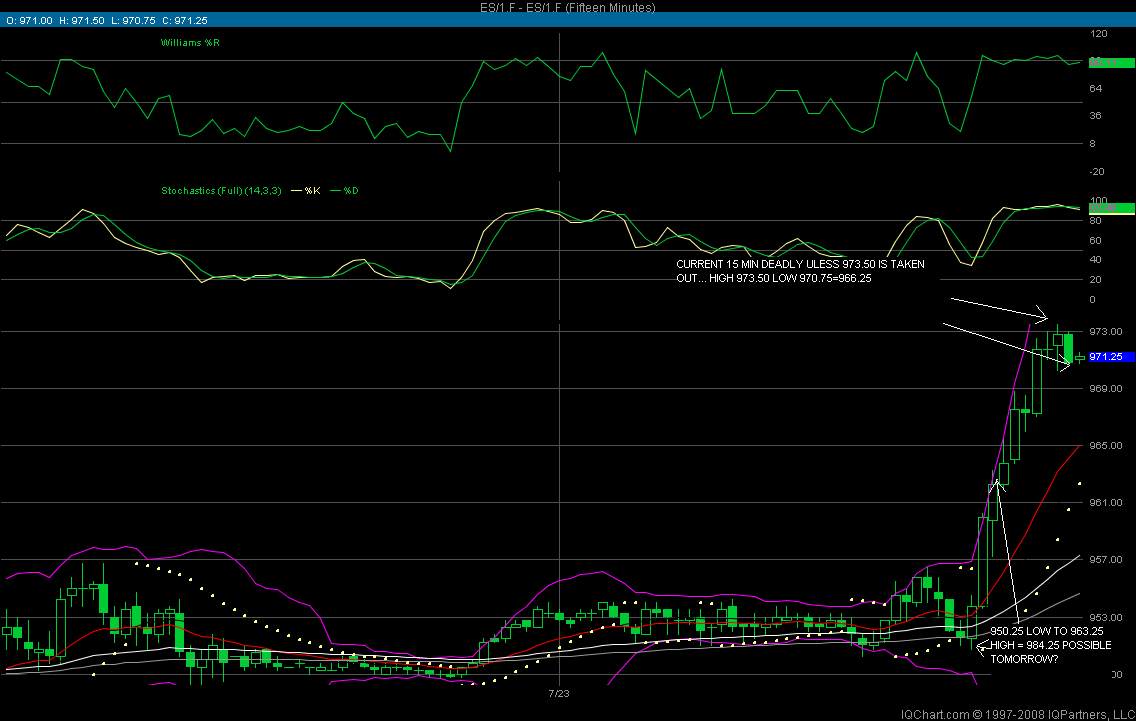
The 7 waves down on the 15 minute started on January 5th?
No,Smithgar, much shorter term it started at 750.75 on 2-27 as seen on the above chart
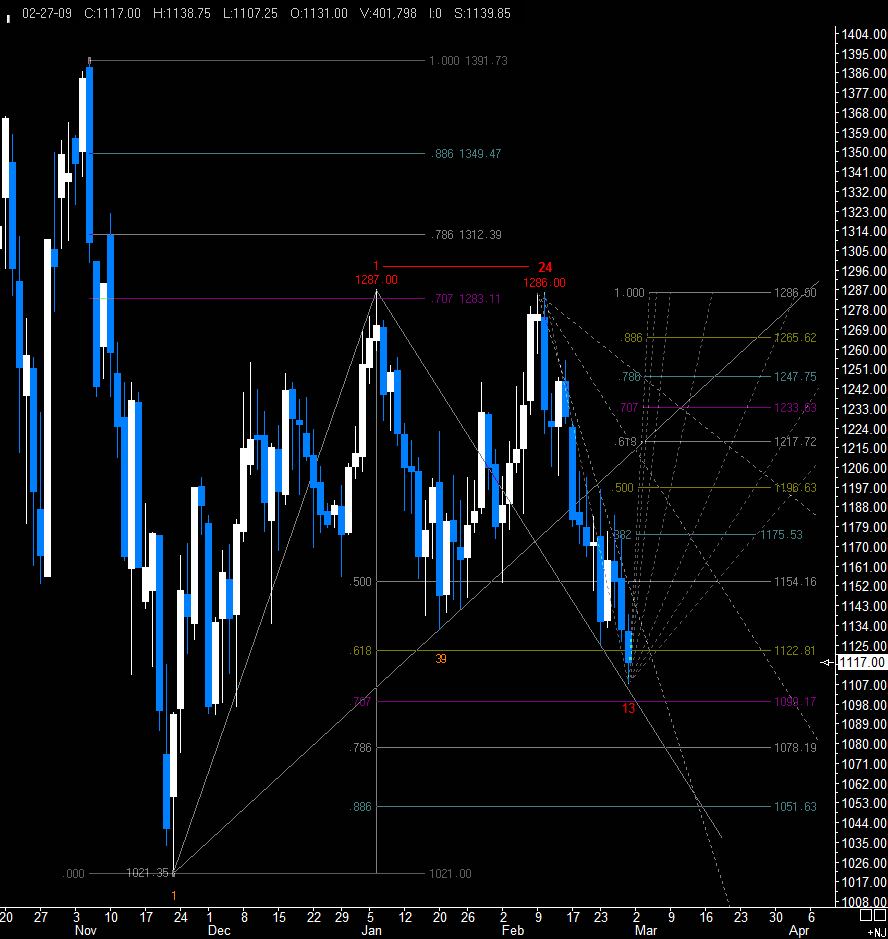
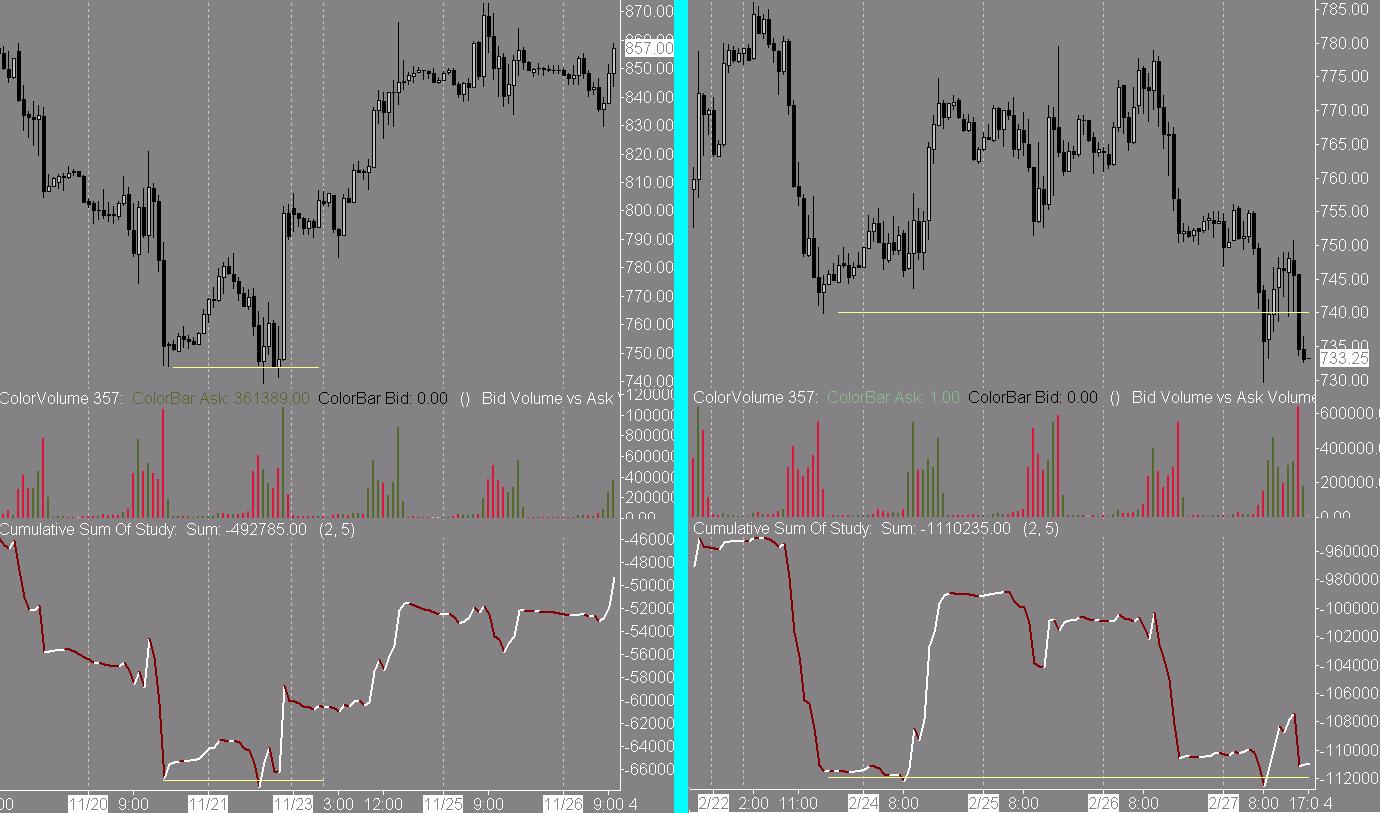
Was comparing recent cumulative volume action in the ES to 21NOV08. I thought the similarities were valid of a post.
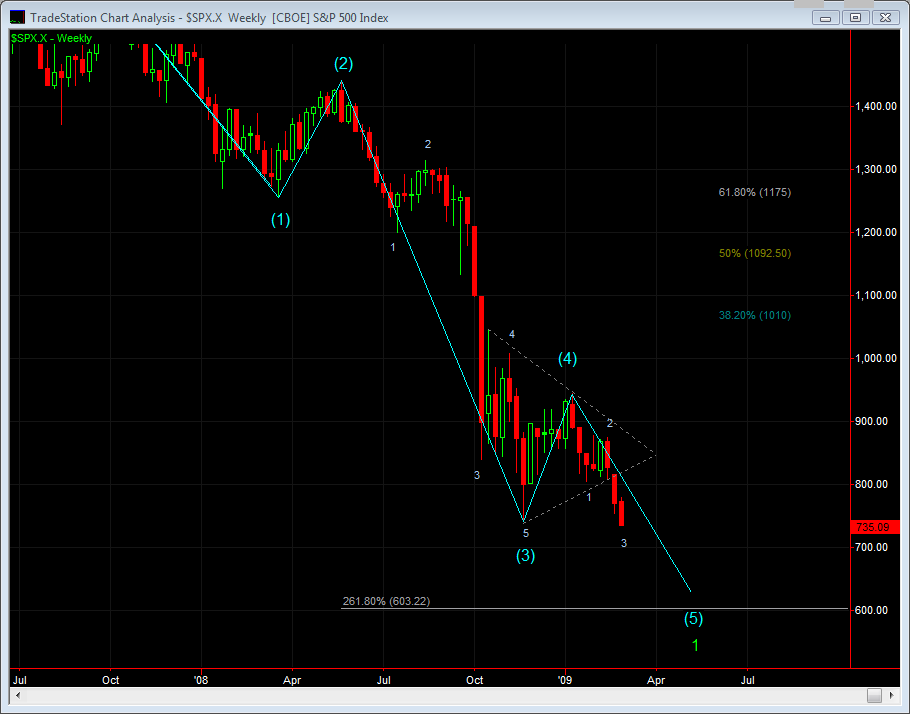
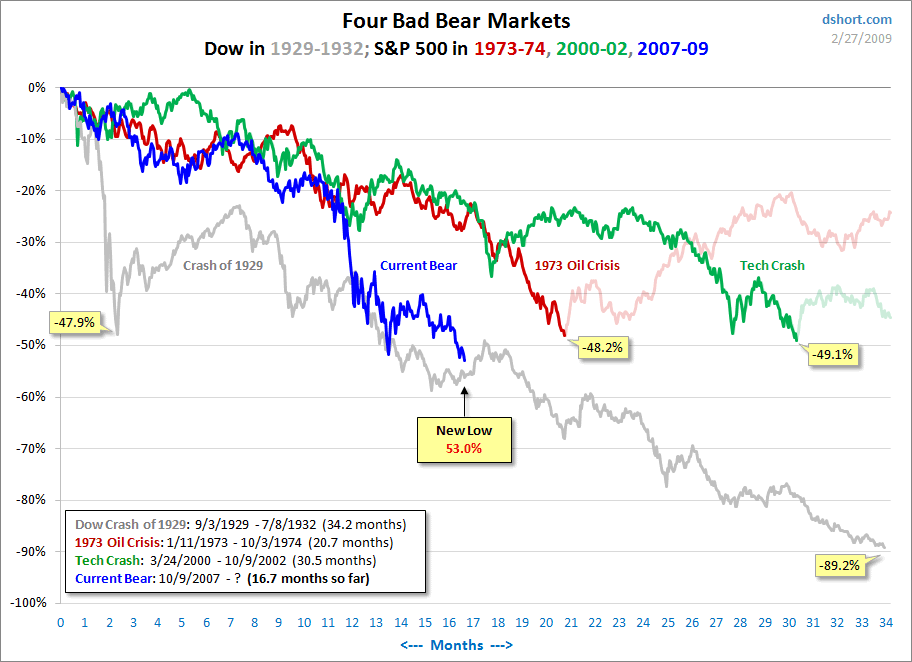
To put things in perspective in terms of time check this out . We're likely only a little over halfway through this 'nightmare'.
Emini Day Trading /
Daily Notes /
Forecast /
Economic Events /
Search /
Terms and Conditions /
Disclaimer /
Books /
Online Books /
Site Map /
Contact /
Privacy Policy /
Links /
About /
Day Trading Forum /
Investment Calculators /
Pivot Point Calculator /
Market Profile Generator /
Fibonacci Calculator /
Mailing List /
Advertise Here /
Articles /
Financial Terms /
Brokers /
Software /
Holidays /
Stock Split Calendar /
Mortgage Calculator /
Donate
Copyright © 2004-2023, MyPivots. All rights reserved.
Copyright © 2004-2023, MyPivots. All rights reserved.
