Primary Pullback Methodology
Tonites Globex presented exactly what I look for in pullback setups. The attached chart illustrates.
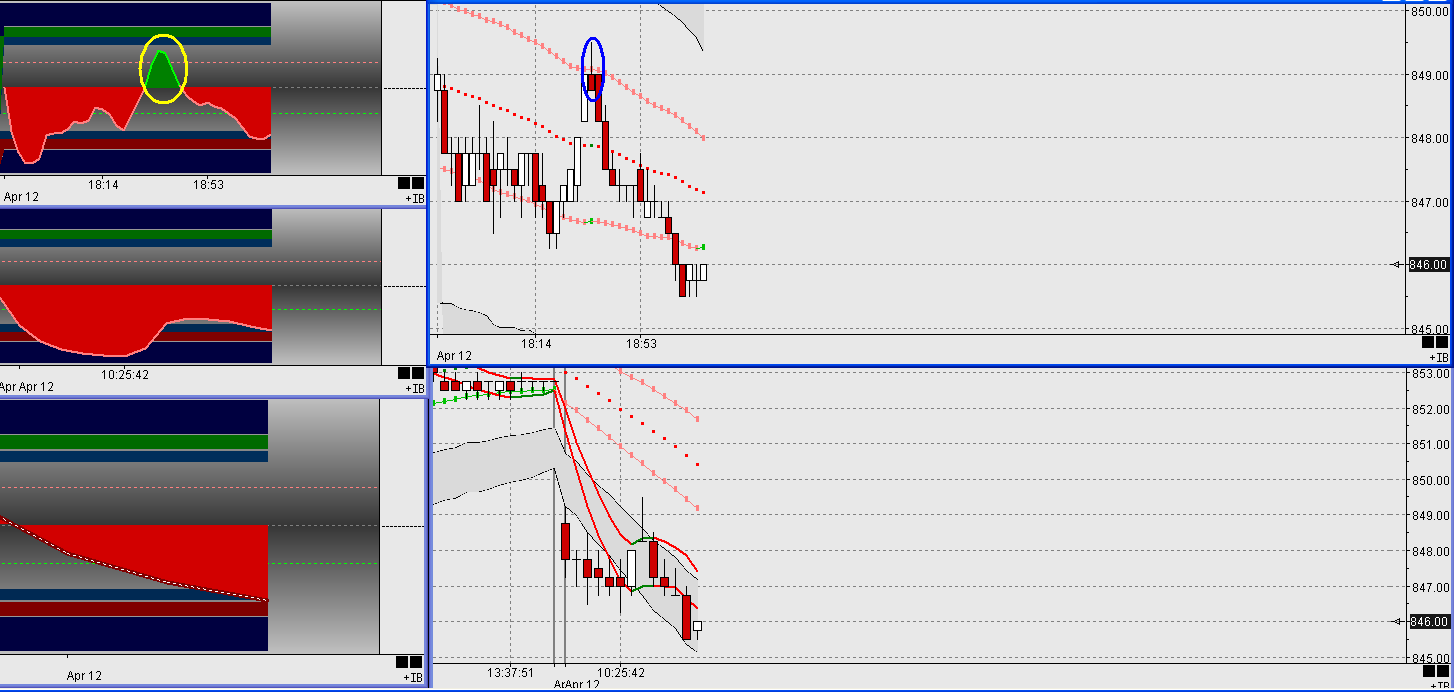
The indicators on the left are a smoothed RSIs. The time frames are, from top to bottom, 29tick, 87tick (multiple of 3), and 435tick (further multiple of 5). When indicator is below midline, its red, green above. An ideal setup for me (for a short) is the highest TF to be red and falling, mid TF to be red and away from midline, and low TF to cross the midline (green). This small rally sets up the short. The charts on the right are, 29tick (top, low TF) and 87tick (bottom, mid TF). Ideally, the bands on both are falling. I enter on a sign of weakness in the area of the band. Ive highlited the shooting star candle on tonites setup. Initial target is retest of low, but ultimate goal is when low TF indicator reaches oversold extreme again.
These are high % setups, and during a trading day a number of these are available. There are variations on this basic setup, but I wanted to show the underlying logic. Hopefully, I managed to do this to some degree.
Click image for original size
Emini Day Trading /
Daily Notes /
Forecast /
Economic Events /
Search /
Terms and Conditions /
Disclaimer /
Books /
Online Books /
Site Map /
Contact /
Privacy Policy /
Links /
About /
Day Trading Forum /
Investment Calculators /
Pivot Point Calculator /
Market Profile Generator /
Fibonacci Calculator /
Mailing List /
Advertise Here /
Articles /
Financial Terms /
Brokers /
Software /
Holidays /
Stock Split Calendar /
Mortgage Calculator /
Donate
Copyright © 2004-2023, MyPivots. All rights reserved.
Copyright © 2004-2023, MyPivots. All rights reserved.