My 2 Cents for 4-28
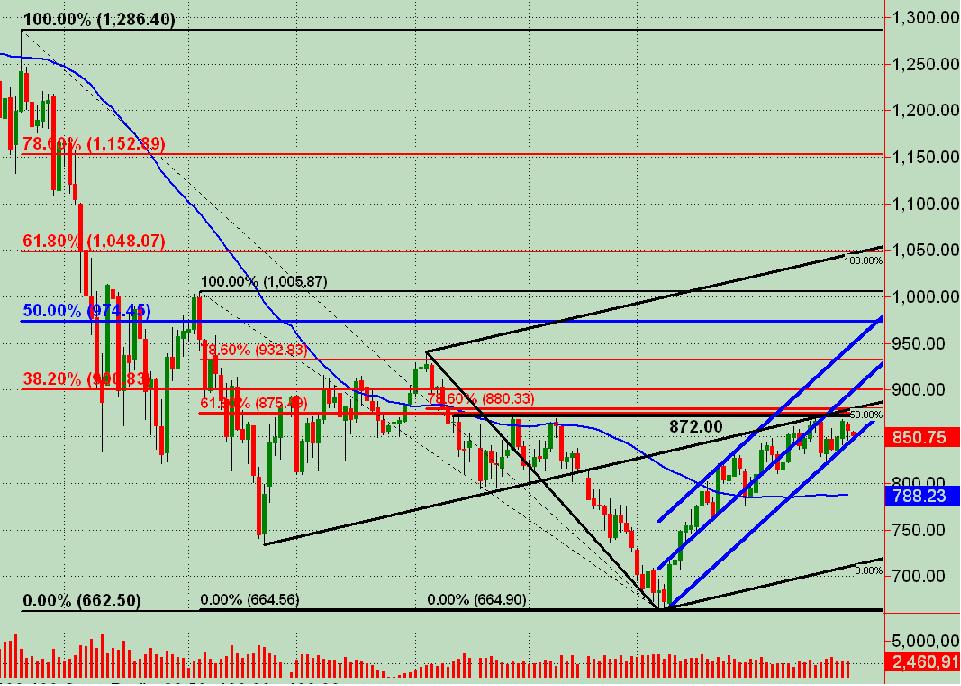
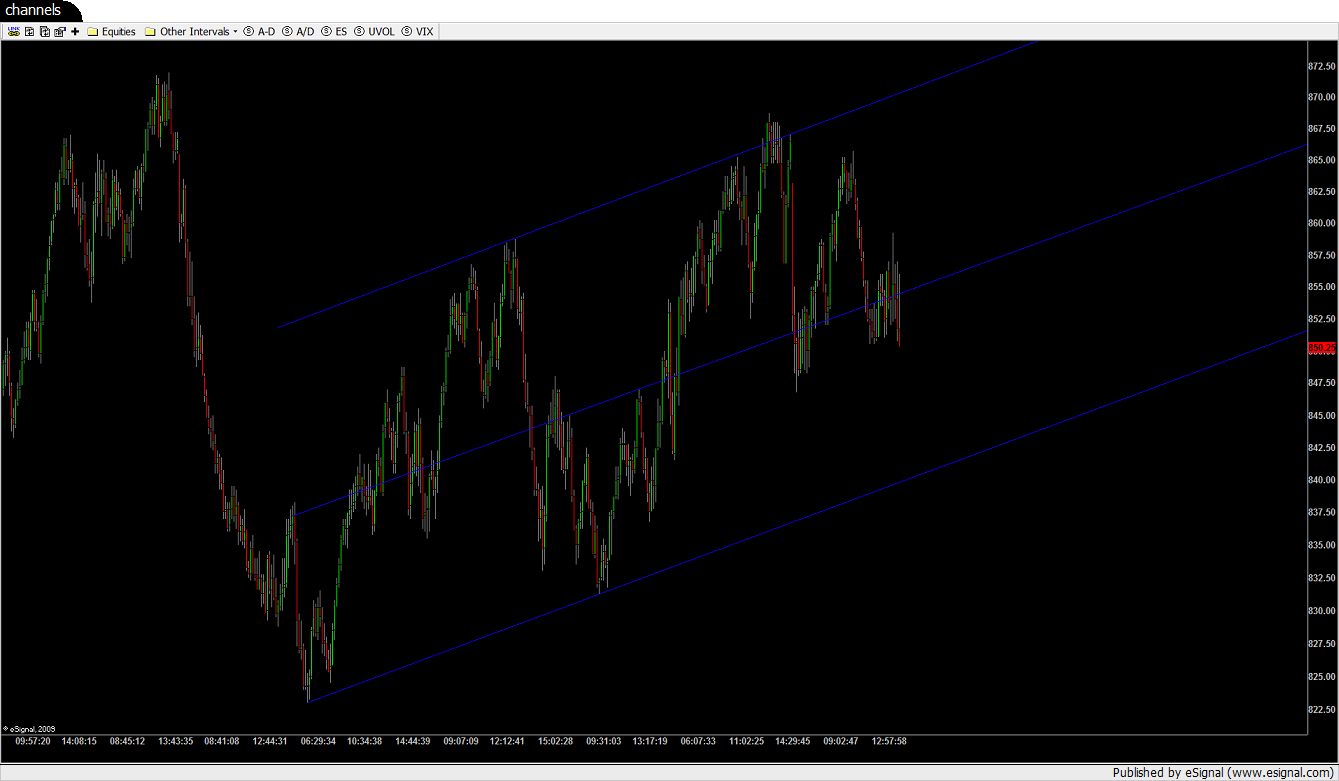
ES daily big picture ... 870-872 price swing highs 3 or 4 times since early January (black horizontal line) as resistance. Also, 2 fib retracements (red horizontal lines) ... one at 875 (.618) and another at 880 (.786). A Midline currently in 880 area. The blue lines are a trend channel drawn from the March lows.
Click image for original size
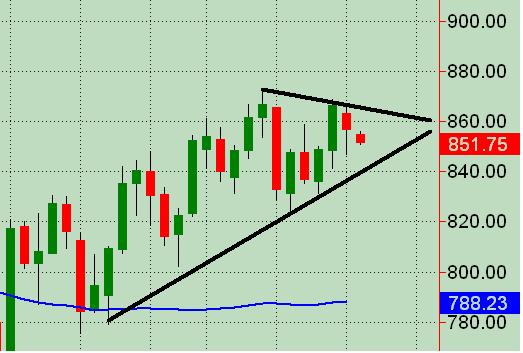
Drilling down on the daily ES chart ... have price constriction/wedge coming into a significant resistance AND semi-significant support area shown in prior chart above. Probably due for a decent price move either way w/in next day or few. Upside tgts. 880 initially w/room to 900, espec if mkt keeps its 7 week bull force intact. Downside tgts. ... if 849-850 daily gap from 4/23-4/24 is broken then 846-847 initially and then 836-838 where there's a weekly S1, daily S2 and prior price action support.
Click image for original size
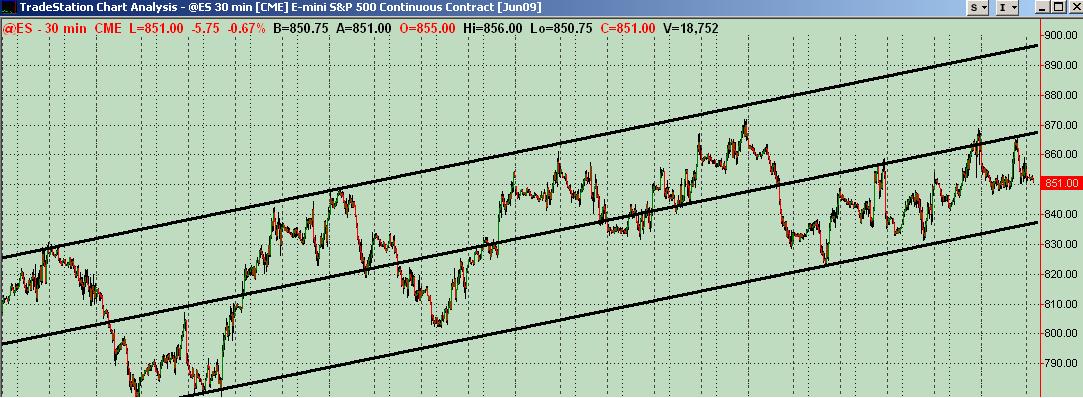
One more chart to chew on ... ES 30 minute trend channel ... something to watch and take into consideration.
Click image for original size
Would desire any feedback and what anyone else is seeing !!
Click image for original size
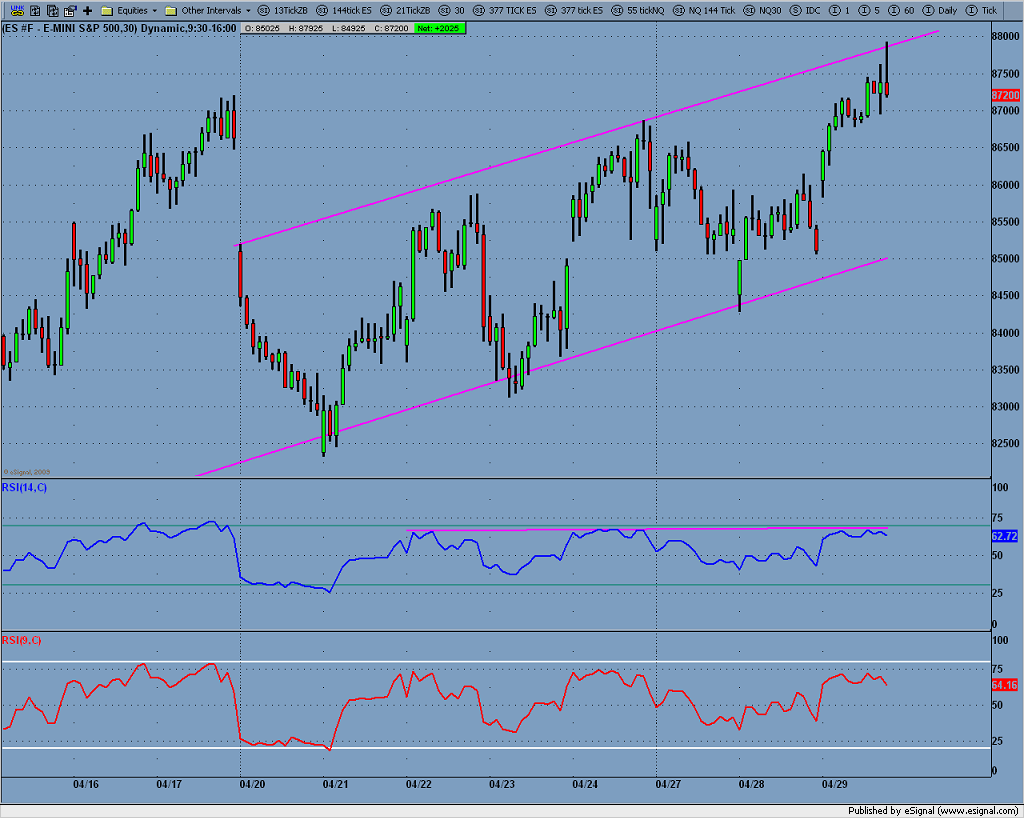
We really needed to trade within channel on the pullback. My 5000T:
Click image for original size
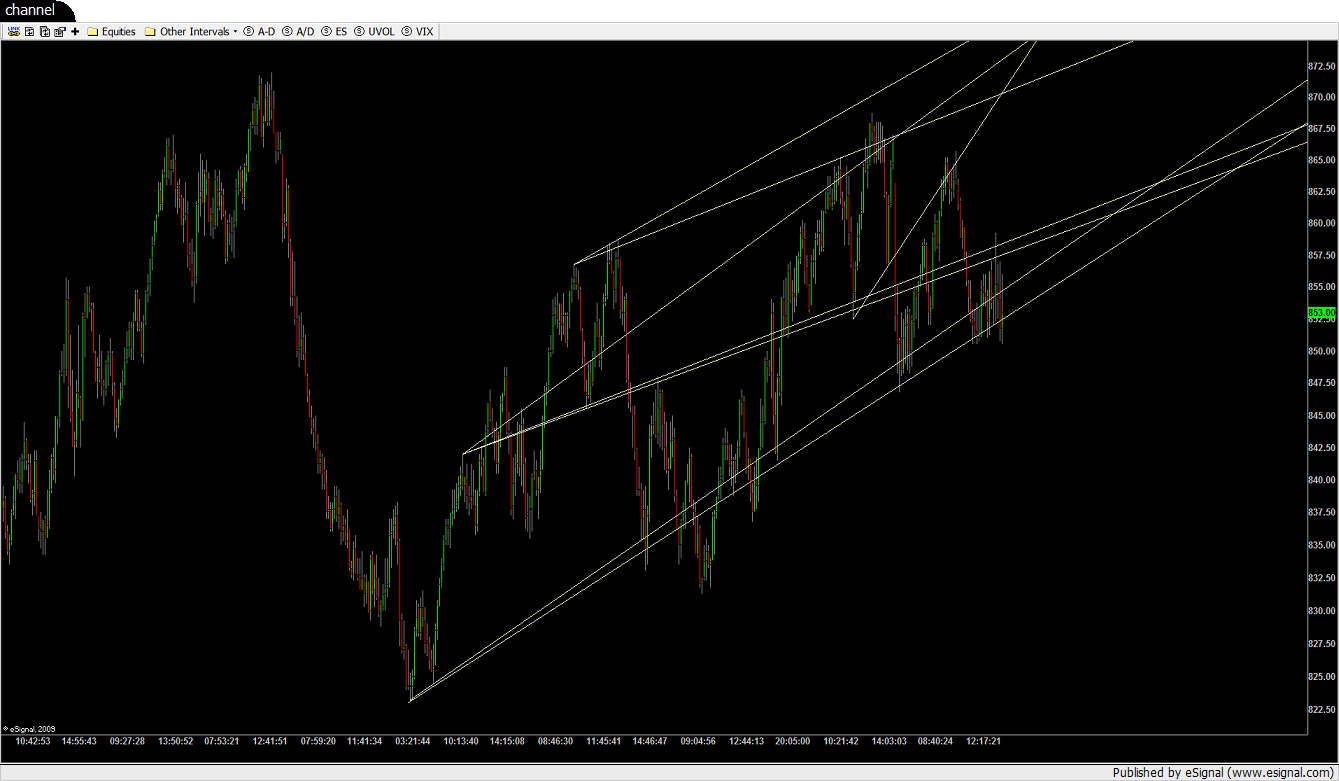
Here're lines by Elliot's rules. We've already had a throw over if you can call it a third trading below the first and second wave range (it is a two wave pullup after all) which means it's suppose to top and break for a correction, couldn't top its first third wave and now we're trading out of channel intraday. When it breaks channel in the daily you don't move your lines; you start your count and lines in the other direction.
That'll be all I write about it. We're trying as we might not to trade our dreams.
That'll be all I write about it. We're trying as we might not to trade our dreams.
Click image for original size
Emini Day Trading /
Daily Notes /
Forecast /
Economic Events /
Search /
Terms and Conditions /
Disclaimer /
Books /
Online Books /
Site Map /
Contact /
Privacy Policy /
Links /
About /
Day Trading Forum /
Investment Calculators /
Pivot Point Calculator /
Market Profile Generator /
Fibonacci Calculator /
Mailing List /
Advertise Here /
Articles /
Financial Terms /
Brokers /
Software /
Holidays /
Stock Split Calendar /
Mortgage Calculator /
Donate
Copyright © 2004-2023, MyPivots. All rights reserved.
Copyright © 2004-2023, MyPivots. All rights reserved.