MyPivots
Sign In
RO
roofer
Rep: 3,689
Posts: 3,574


Click image for original size
No Description Entered


Click image for original size
No Description Entered


Click image for original size
No Description Entered


Click image for original size


Click image for original size

Click image for original size
No Description Entered


Click image for original size
No Description Entered


Click image for original size
No Description Entered


Click image for original size
No Description Entered
TO
tomo
Rep: 110
Posts: 238
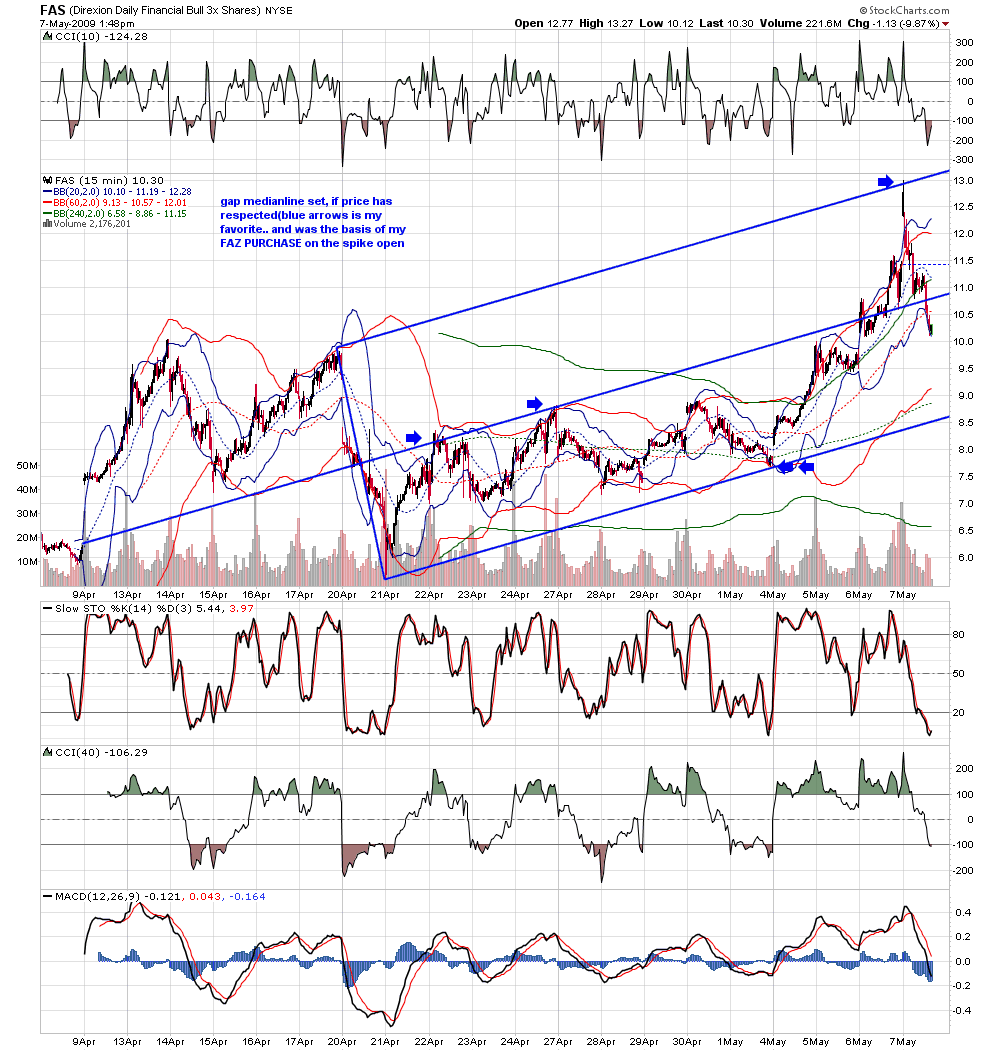
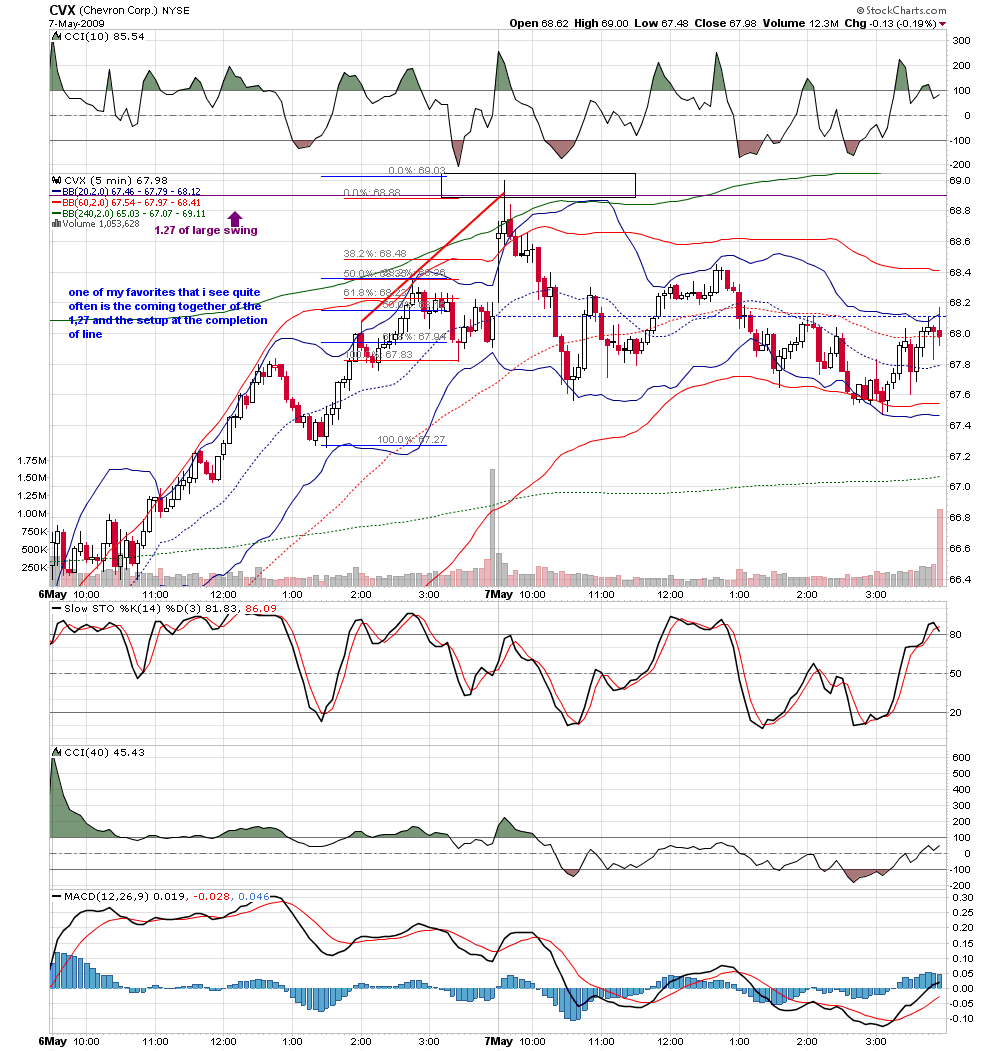
Great setup roofer. Thanks. The same was on the open of ES yesterday :)
JI
jimkane
Rep: 3,058
Posts: 33,089
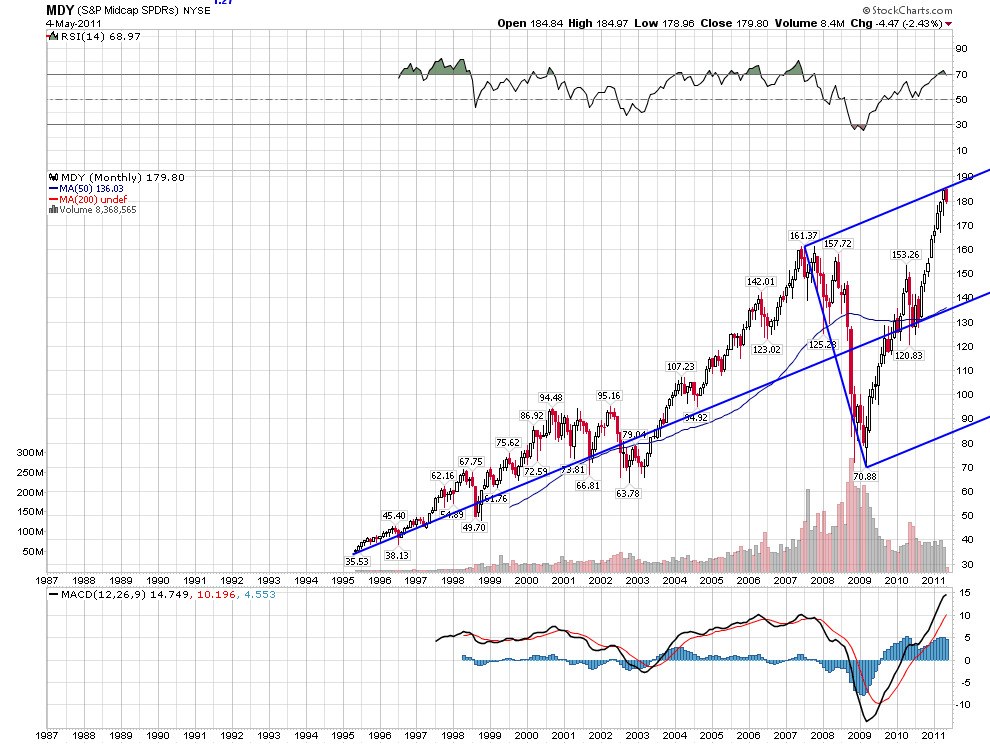
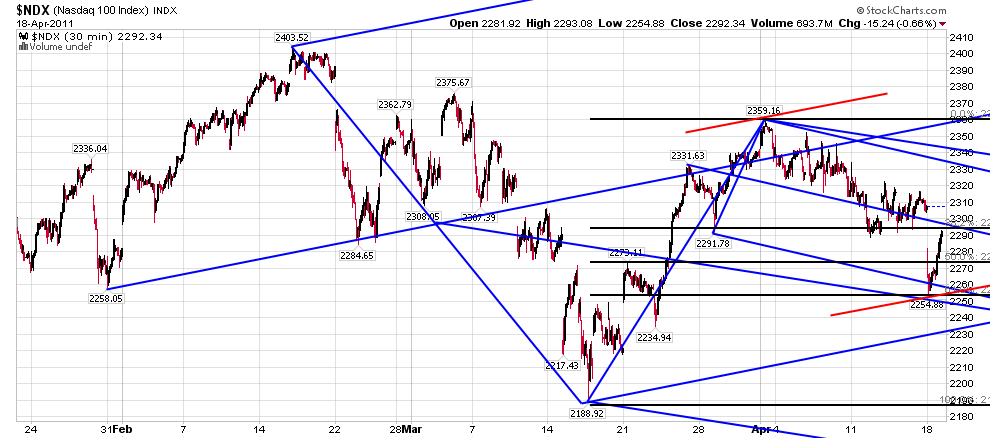
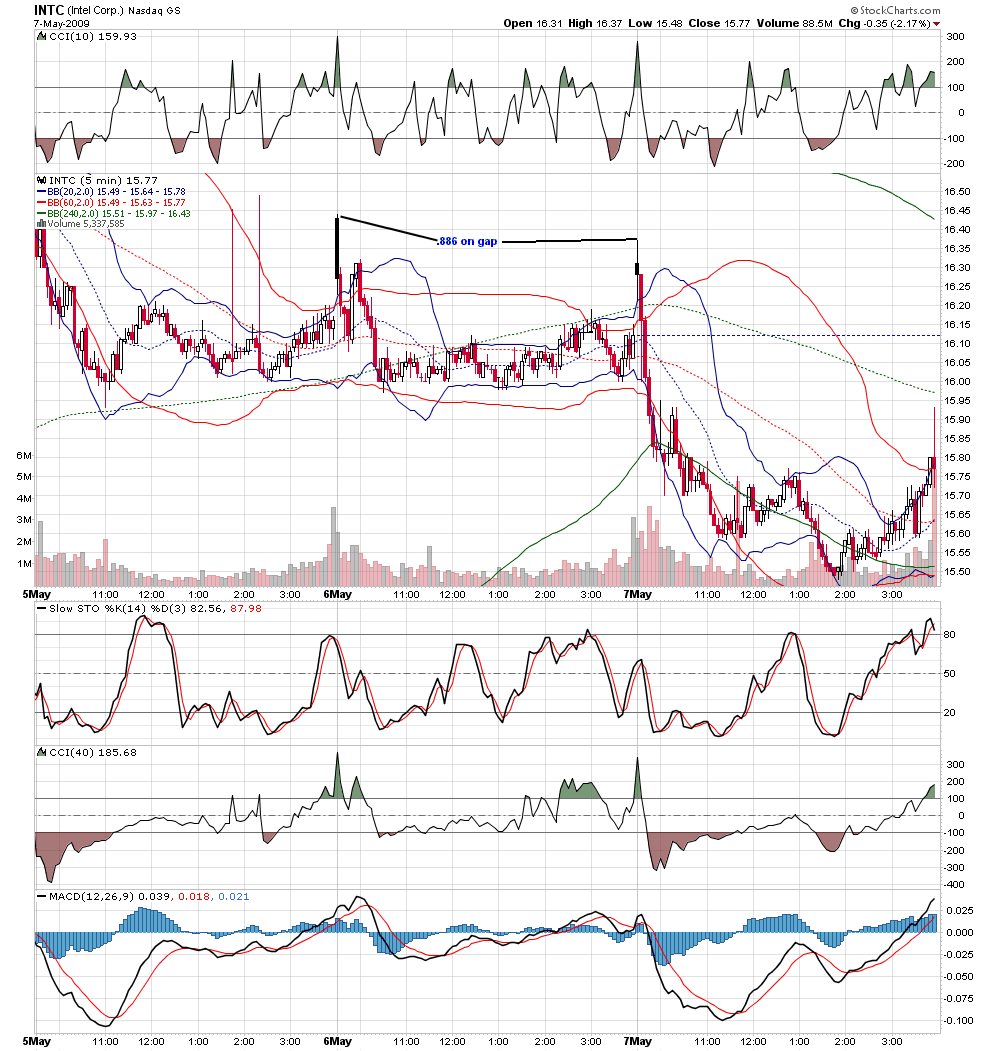
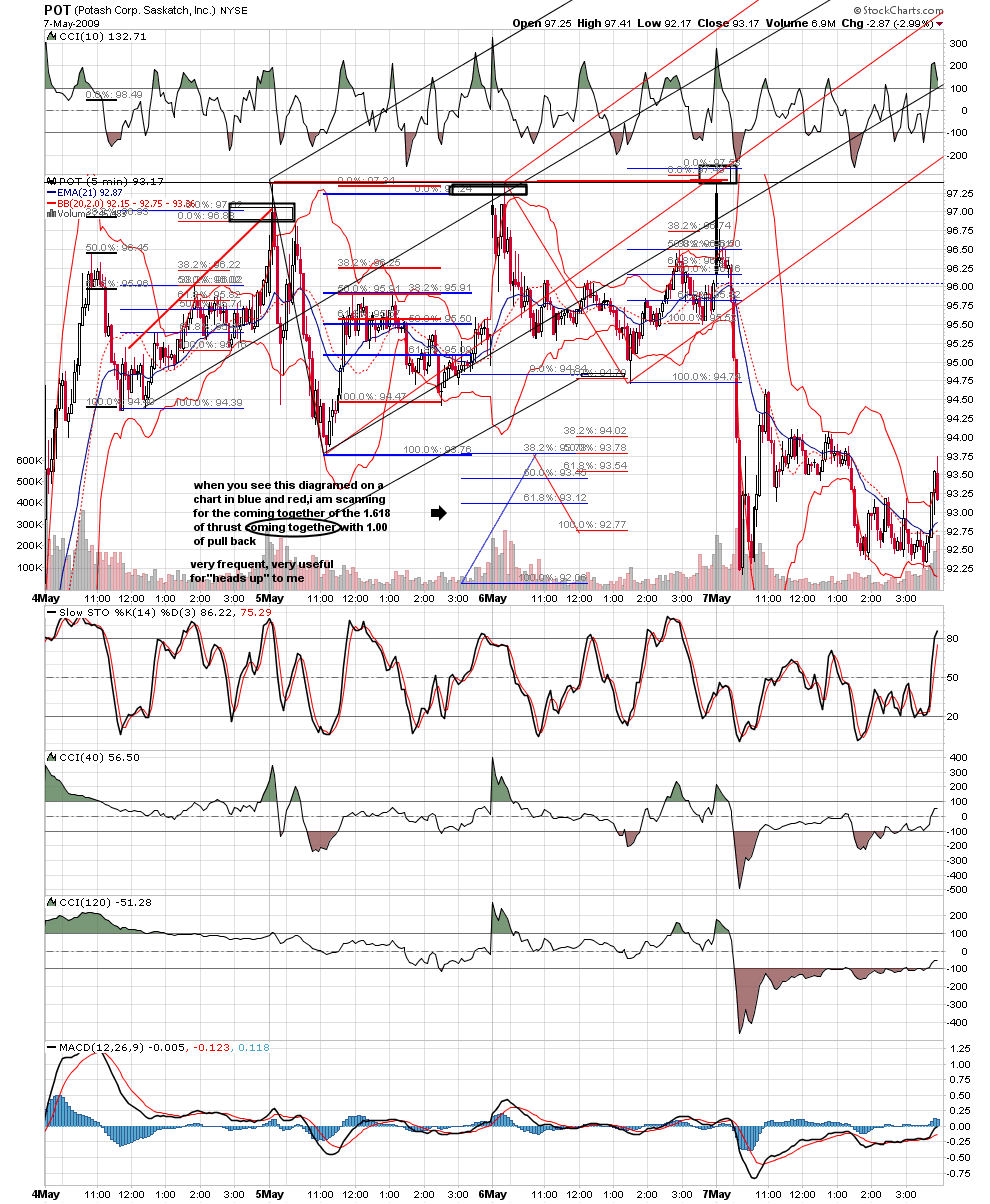
Hey, roofer, great charts. I have a question on the POT chart, the first chart you posted. I follow what you are doing exactly there, in fact it lines up with something I do using expansions and projections (there are actually two levels using this same principal that come in above the first one that are useful for looking for areas where a strong move may weaken). Anyway, on the second example on that chart, I get a much different value for the 1.00 pullback (I get 96.55 with my data). I get the same exact value for your 1.618, and the same values for your other two examples on this chart. If I use the 1.00 bracket from the first example I get the level you have. So, am I missing something here? Can you confirm for me how you got that 1.00 at the spot you did? Thanks. Great work.