March 09, 2005 Charts
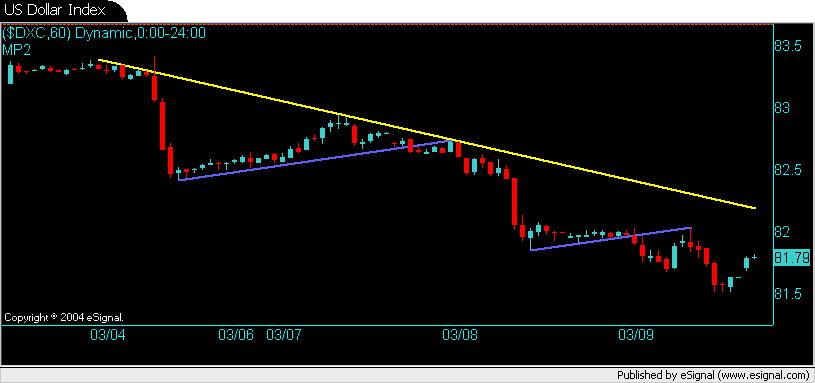
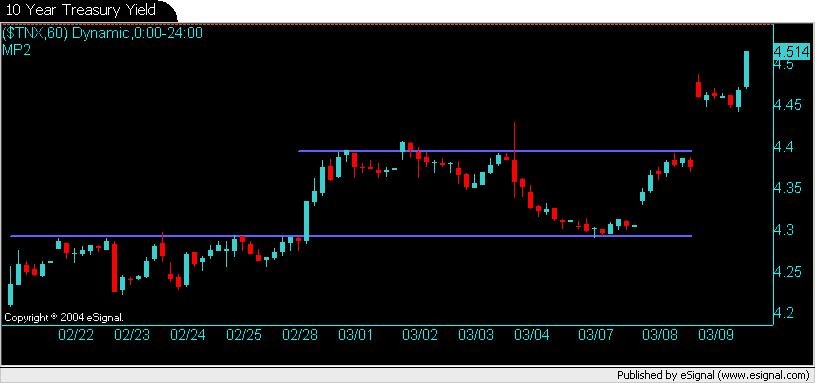
Let's have a look at the damage done so far this week. The trouble started with the weekly chart bear flag in the US dollar which triggered shorts Friday, this spread straight to the interest rate curve. There has been a big bet in the interest rate market, specifically the "bear flattener" trade, a spread trade where hedge funds are long the 10 year notes and short the 2 year notes. The foolish hedge fund managers decided to squeeze the large open short position in the 10 year notes( ie. the "bear flattener" handle). Well the hedge funds recieved an early wake up call first thing this morning, finding themselves trapped long on a technical breakout of 10 year rates. This breakout signals a widening of the yield curve, exactly the opposite of what they all expected to happen, "the curve was supposed to flatten". The funds are now faced with a decision: admit your mistake now and exit at a loss or hang on and hope the curve flattens and lets you out. On the other hand, if your a really stupid hedge fund manager (as most hedge fund managers prove to be in the long run) then you will run to the nearest bank to borrow more money (increase leverage) and average your open loss (ie. keep buying notes as rates trend higher, which they will).
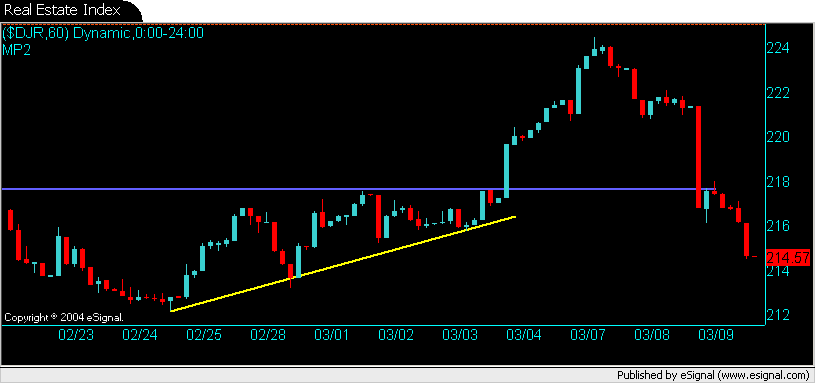
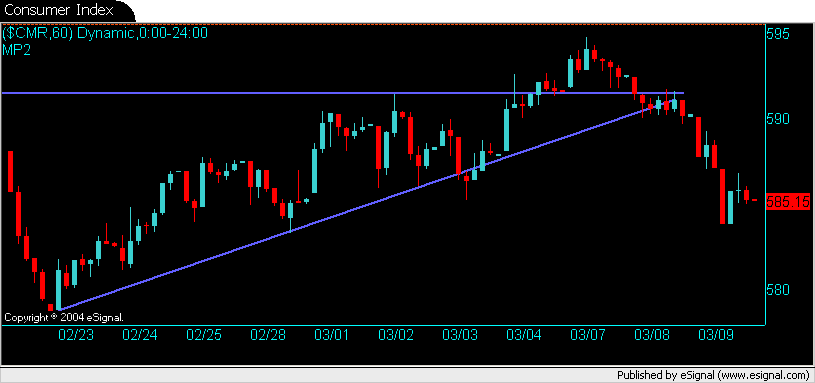
I threw in a couple of charts for the US consumers, which will of course be the end recipients of higher interest rates.
I threw in a couple of charts for the US consumers, which will of course be the end recipients of higher interest rates.
Click image for original size
Click image for original size

Click image for original size
Click image for original size
Click image for original size
Emini Day Trading /
Daily Notes /
Forecast /
Economic Events /
Search /
Terms and Conditions /
Disclaimer /
Books /
Online Books /
Site Map /
Contact /
Privacy Policy /
Links /
About /
Day Trading Forum /
Investment Calculators /
Pivot Point Calculator /
Market Profile Generator /
Fibonacci Calculator /
Mailing List /
Advertise Here /
Articles /
Financial Terms /
Brokers /
Software /
Holidays /
Stock Split Calendar /
Mortgage Calculator /
Donate
Copyright © 2004-2023, MyPivots. All rights reserved.
Copyright © 2004-2023, MyPivots. All rights reserved.